





SeanVega Trading
A running archive of SOX/SOXX (PHLX Semiconductor Sector Index/ETF) views from Tactical Positioning.

Drag, or hold Alt and press the left or right arrow, to reorder within a group. Publications you write for stay ahead of subscriptions. Changes save automatically.
A running archive of SOX/SOXX (PHLX Semiconductor Sector Index/ETF) views from Tactical Positioning.
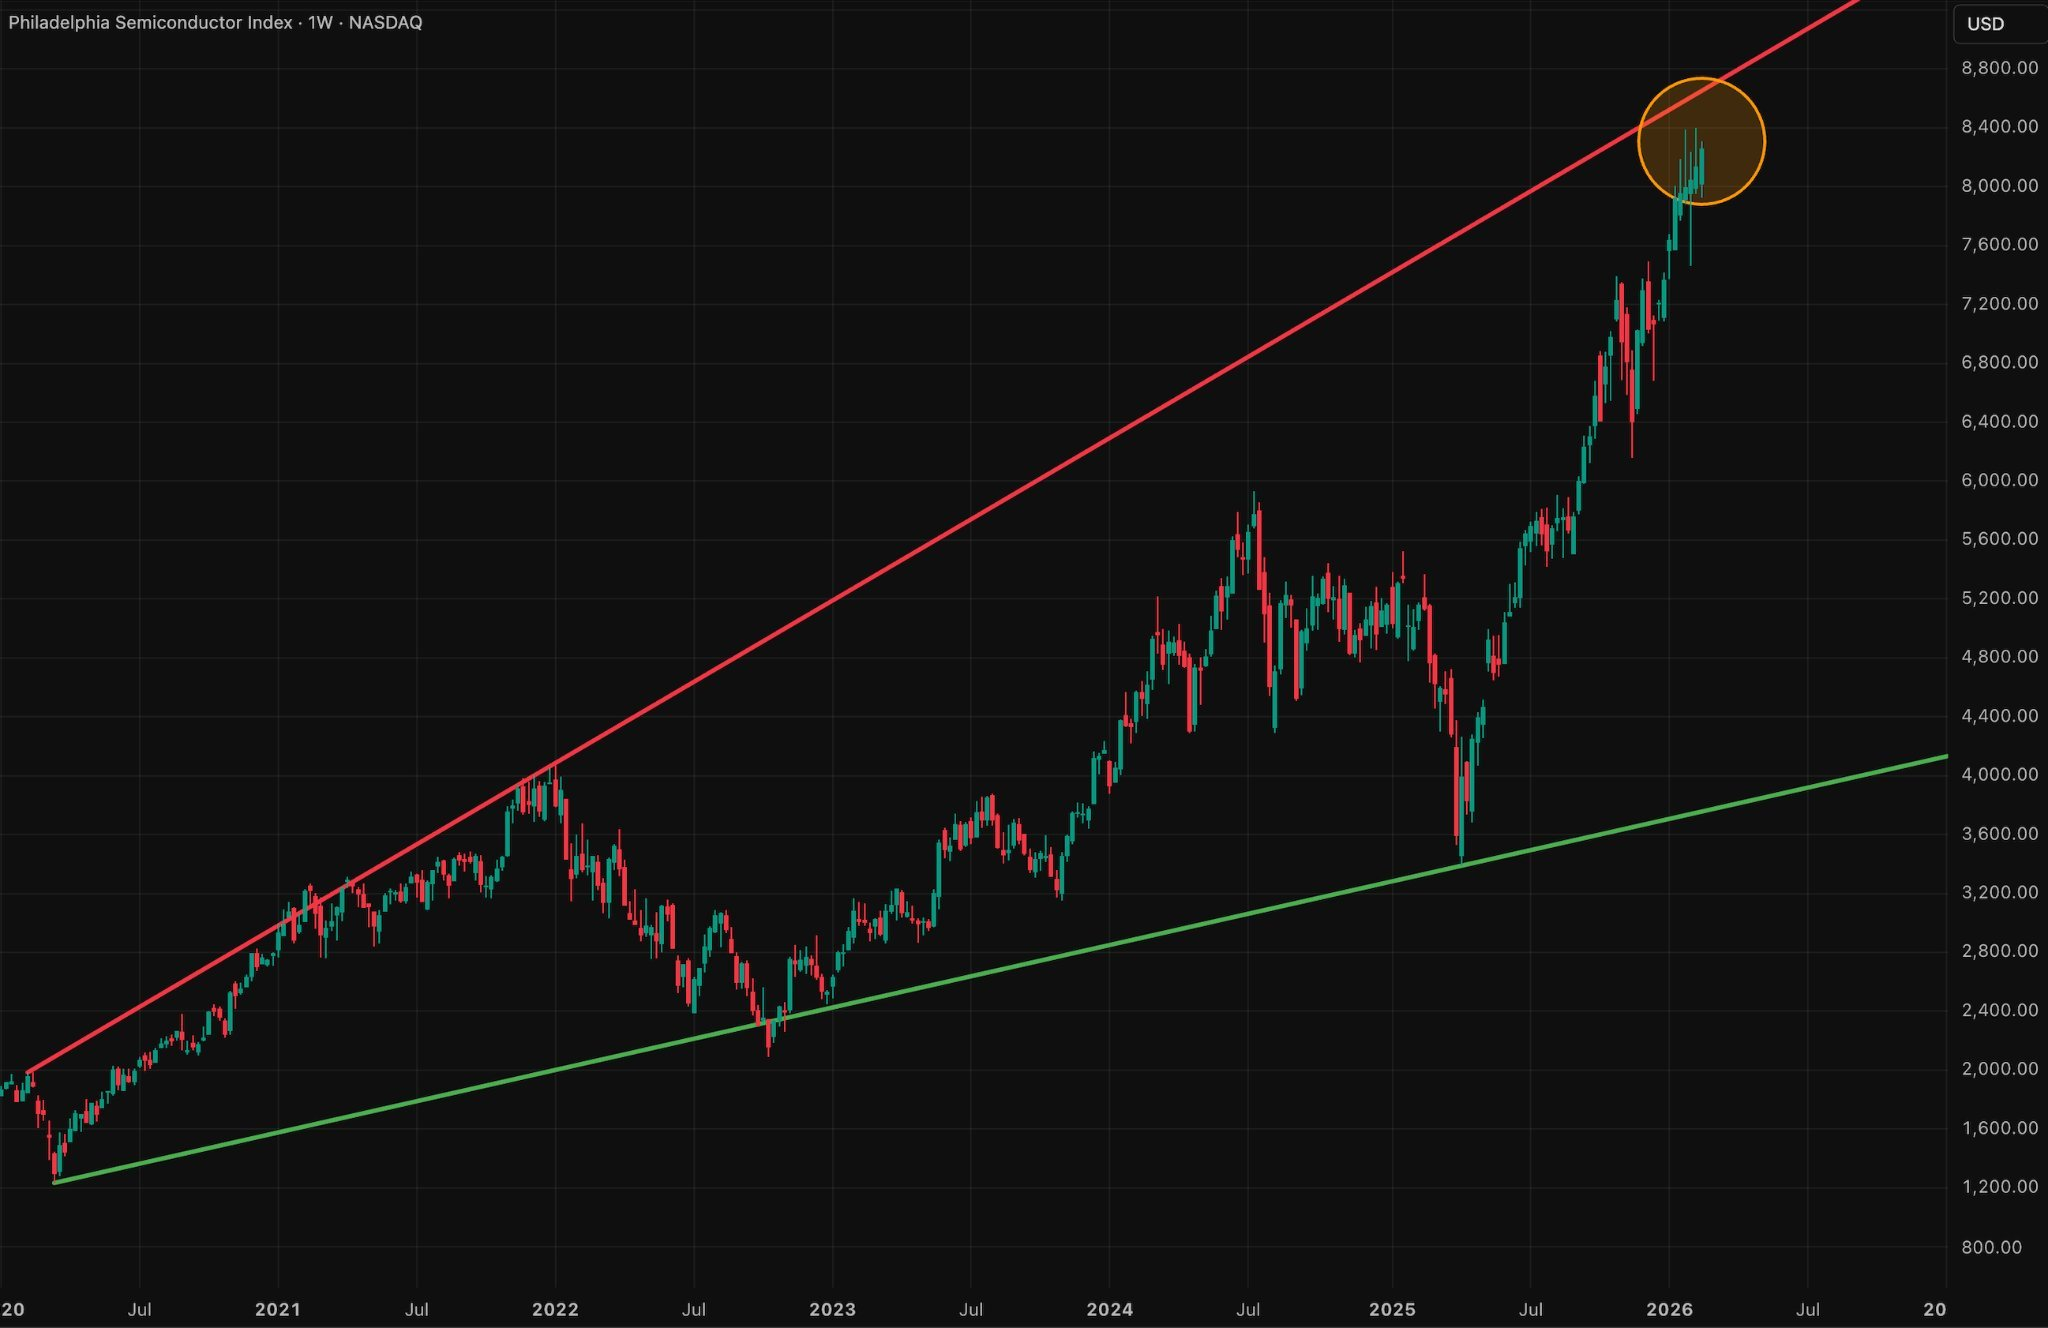
SOXSOX (Semiconductor Index), the bellwether sector, is close to a climax high.
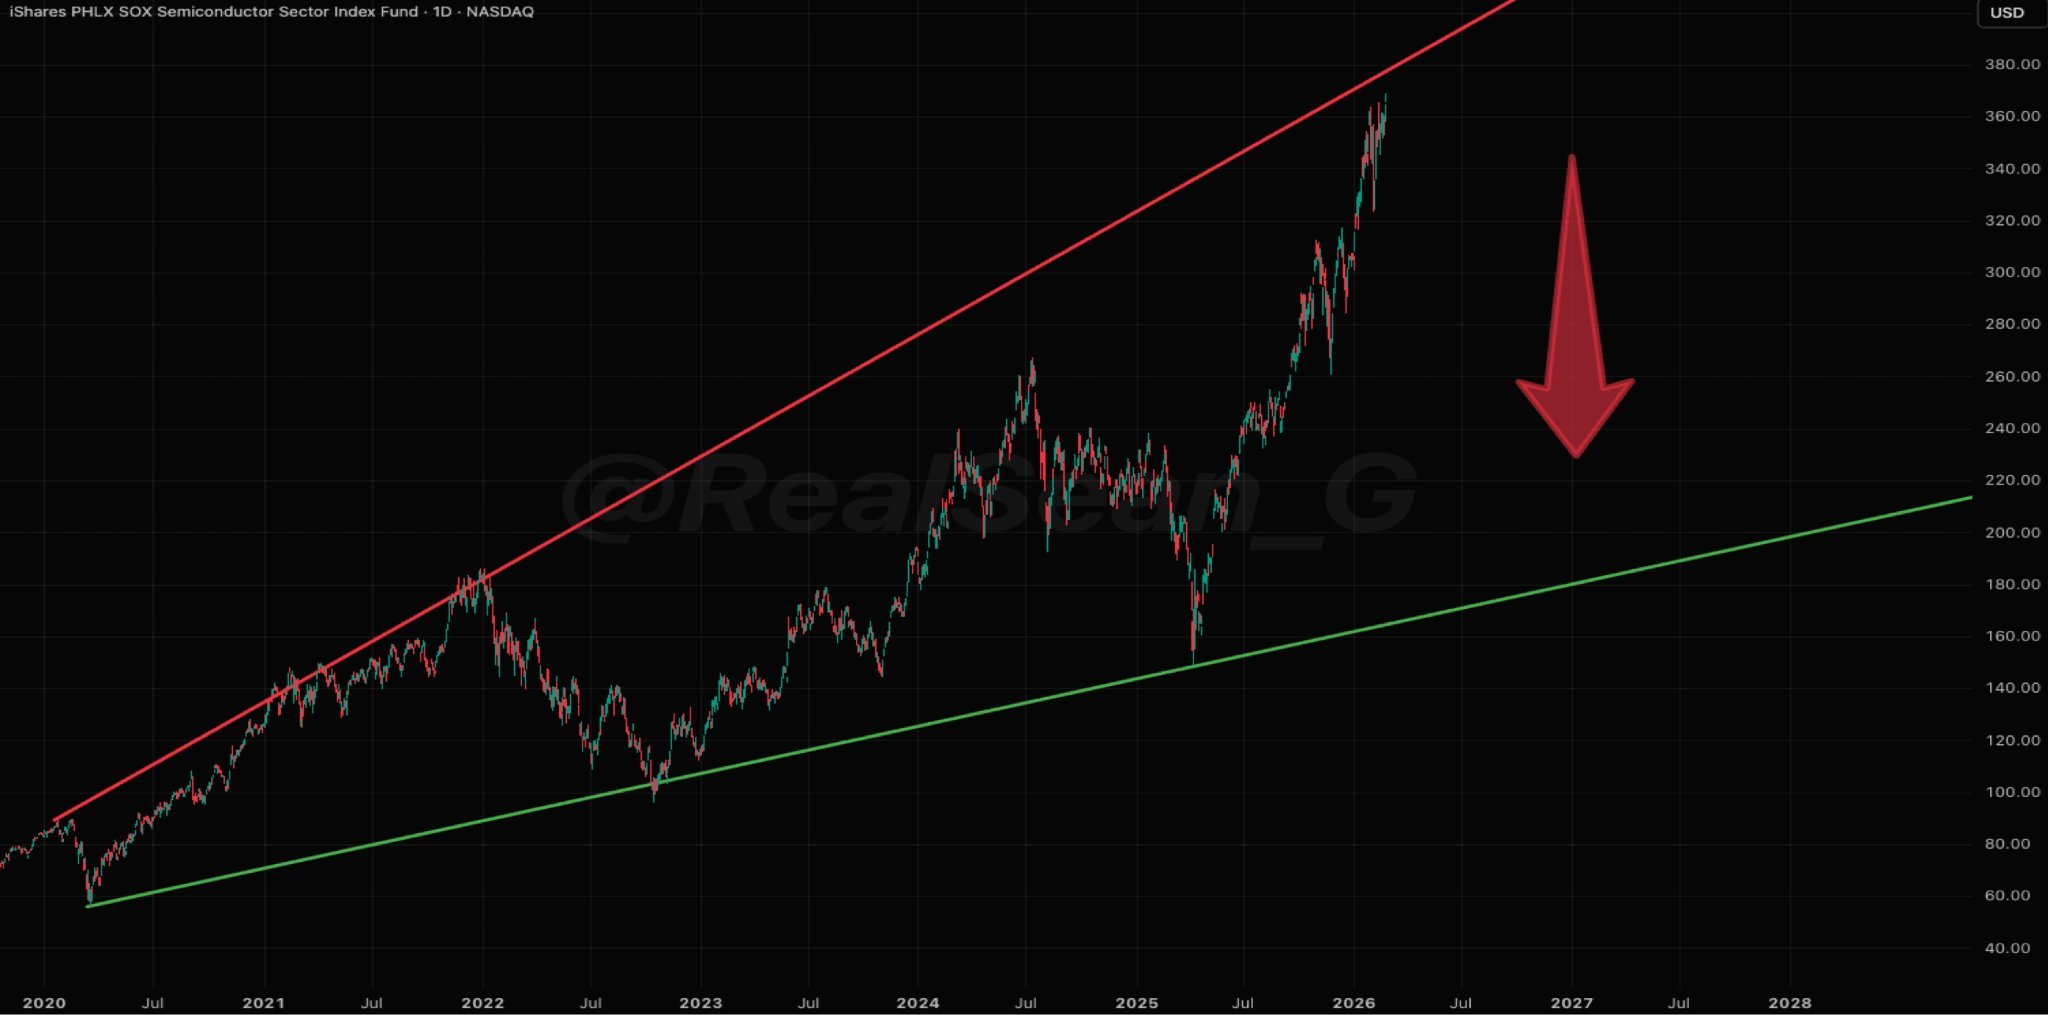
SOXXSOXX (Semiconductor ETF) is very close to completing the pattern.
SOXX monthly Bollinger Band is very extended. KOSPI and TAIEX are also showing extremes. Note that both KOSPI and TAIEX are heavily concentrated in the semiconductor sector.
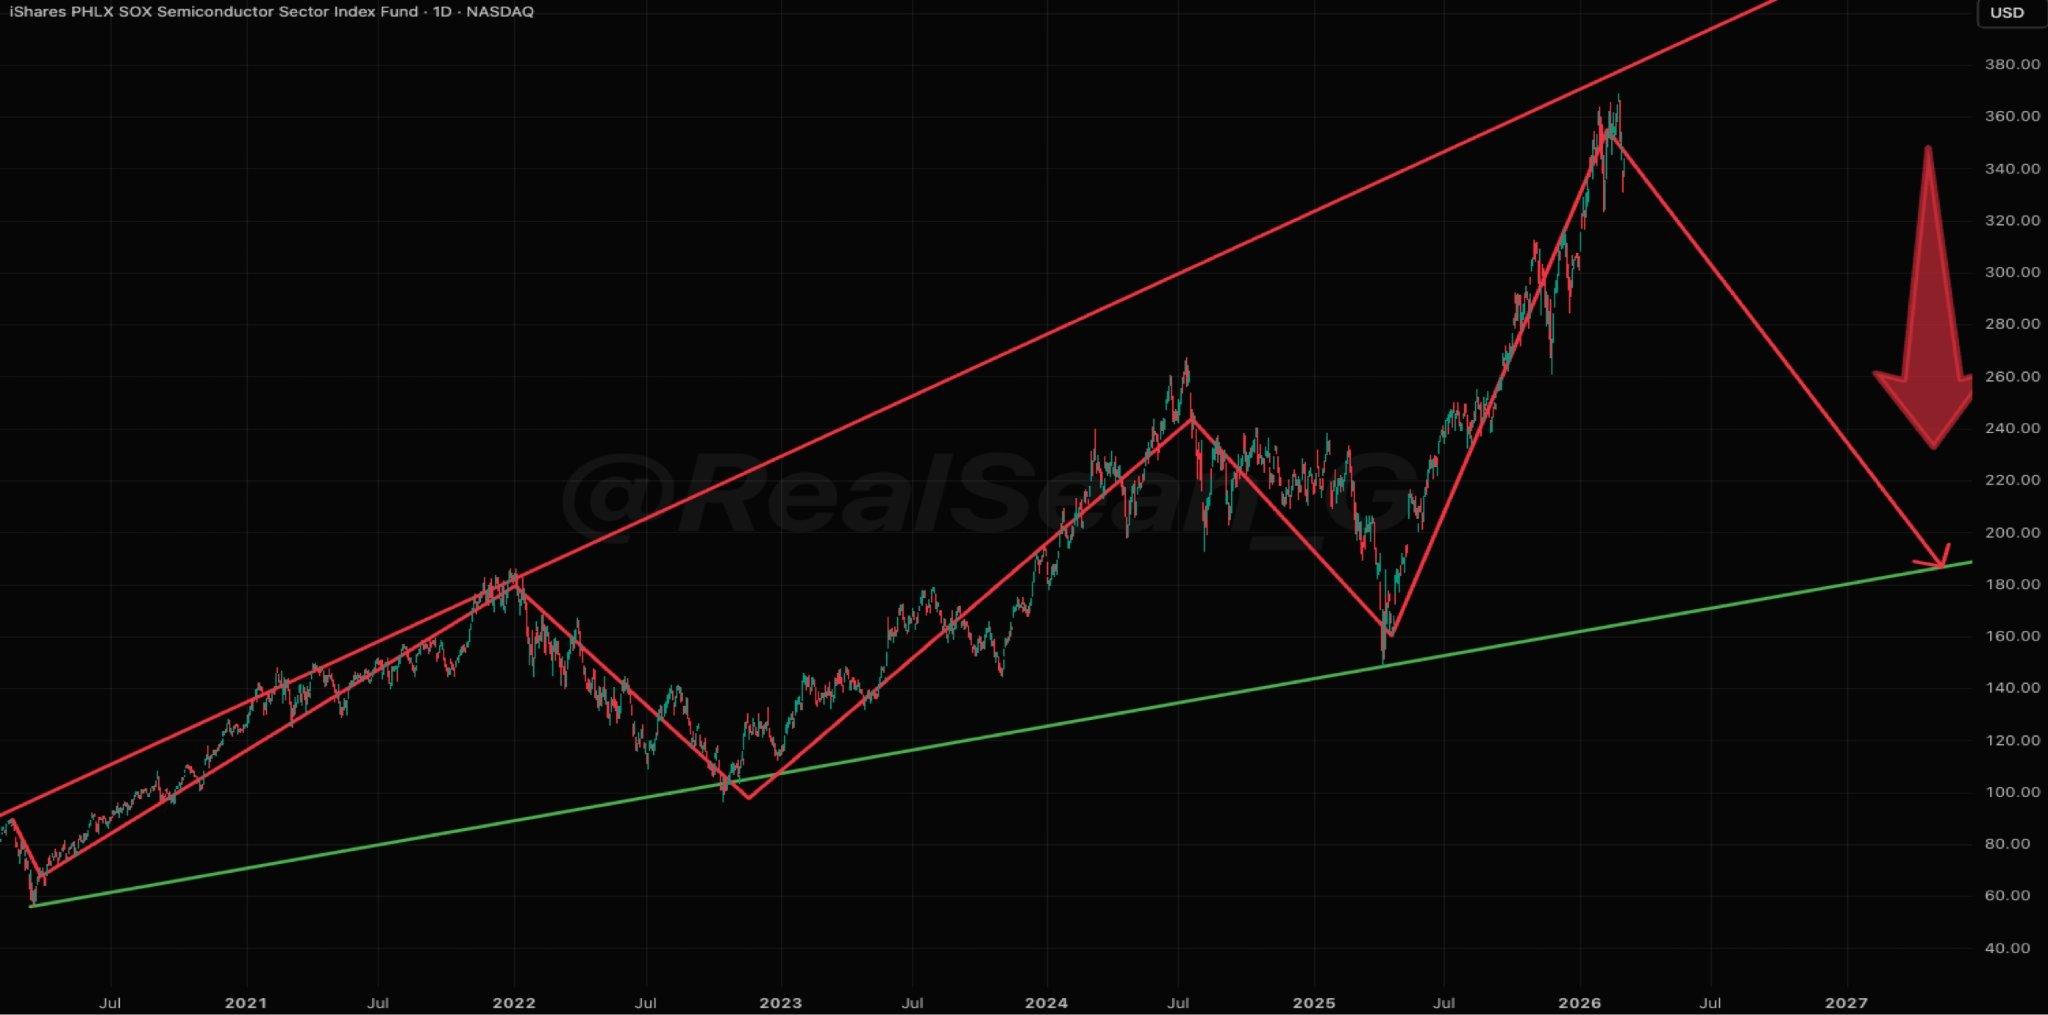
SOXXWe might have seen the top in SOXX (Semiconductor ETF), as the final leg does not require completion. If I am right, we should see it halved, which is the same magnitude of drawdown I am expecting from NDX.
SOXXSOXX (Semiconductor ETF) rebounded from a trendline support.
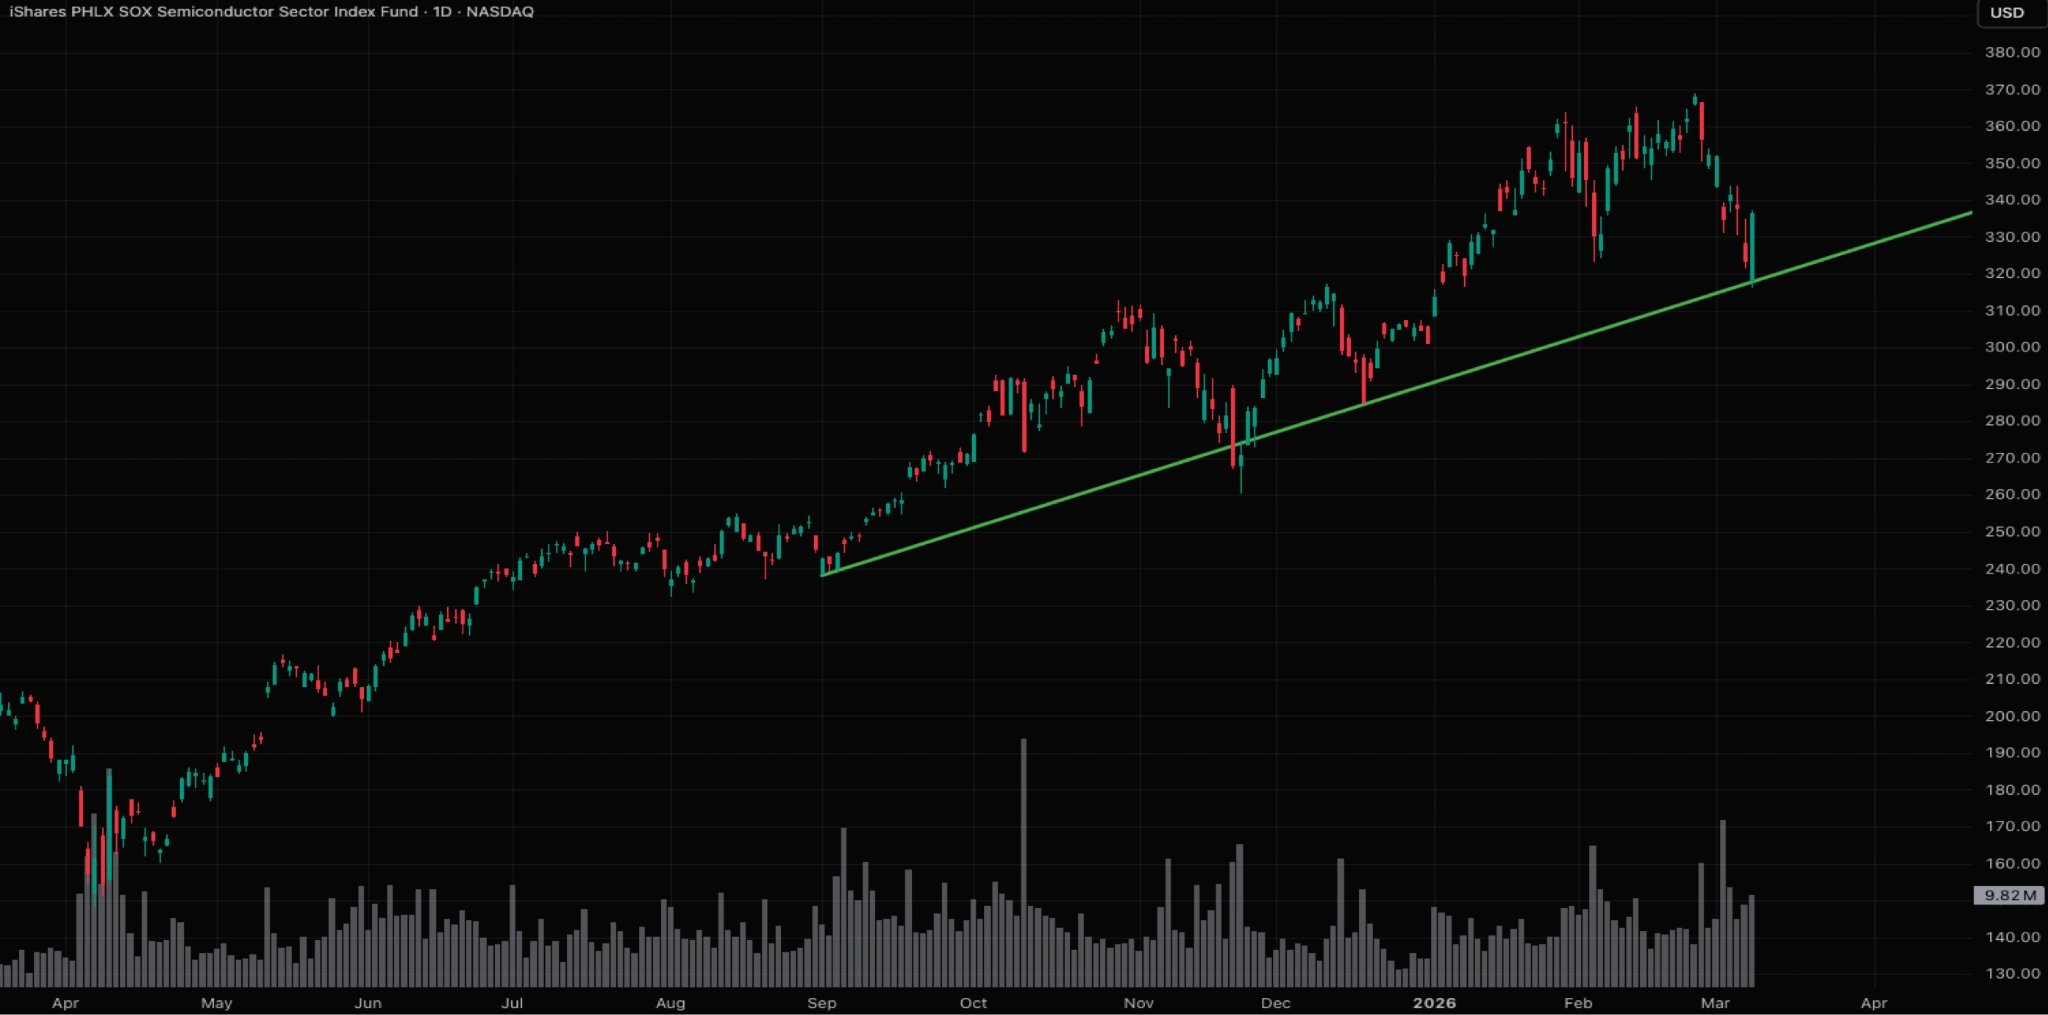
SOXXSOXX (Semiconductor ETF) must reclaim the trendline. Otherwise, the consequences could be devastating for the broader market, as semis are the bellwether sector of this bull run.
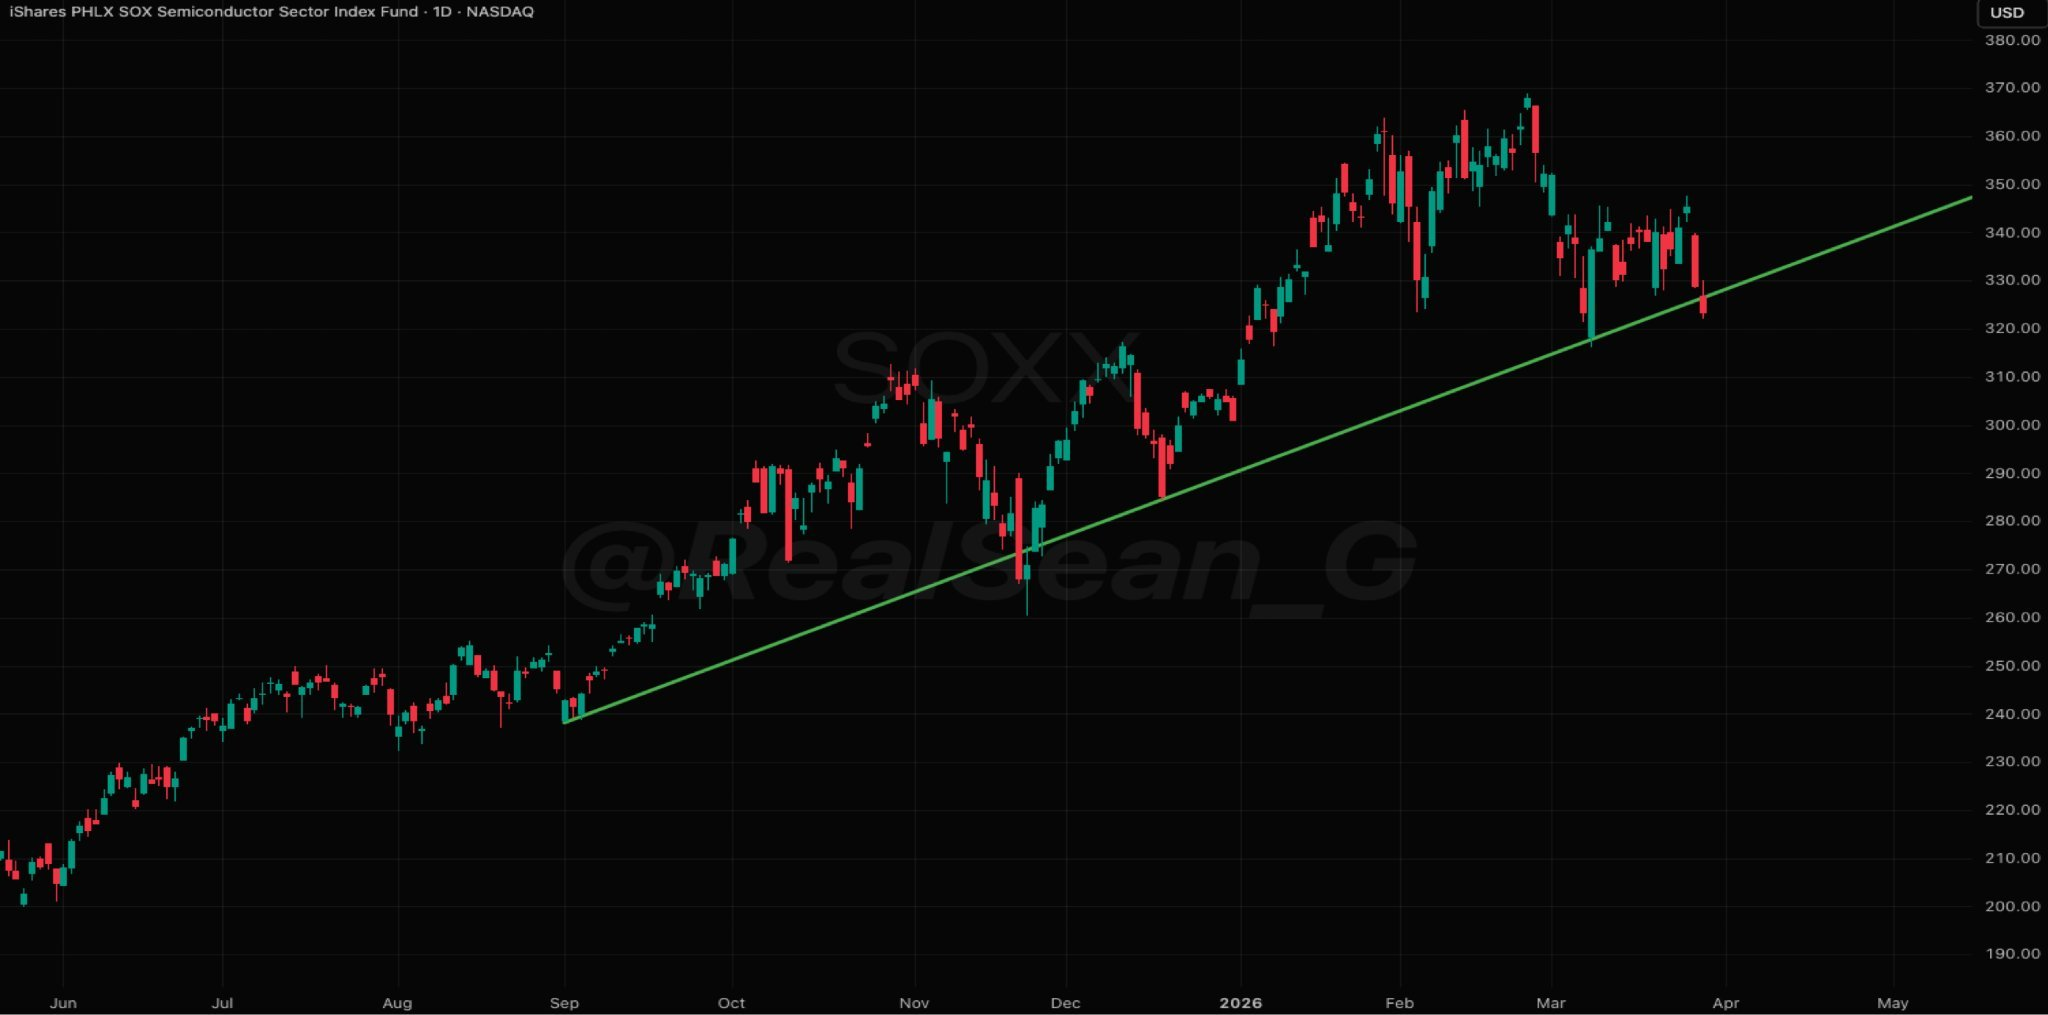
SOXXSOXX (Semiconductor ETF) has reclaimed the major trendline, but it must hold above it for a few days to see further upside.
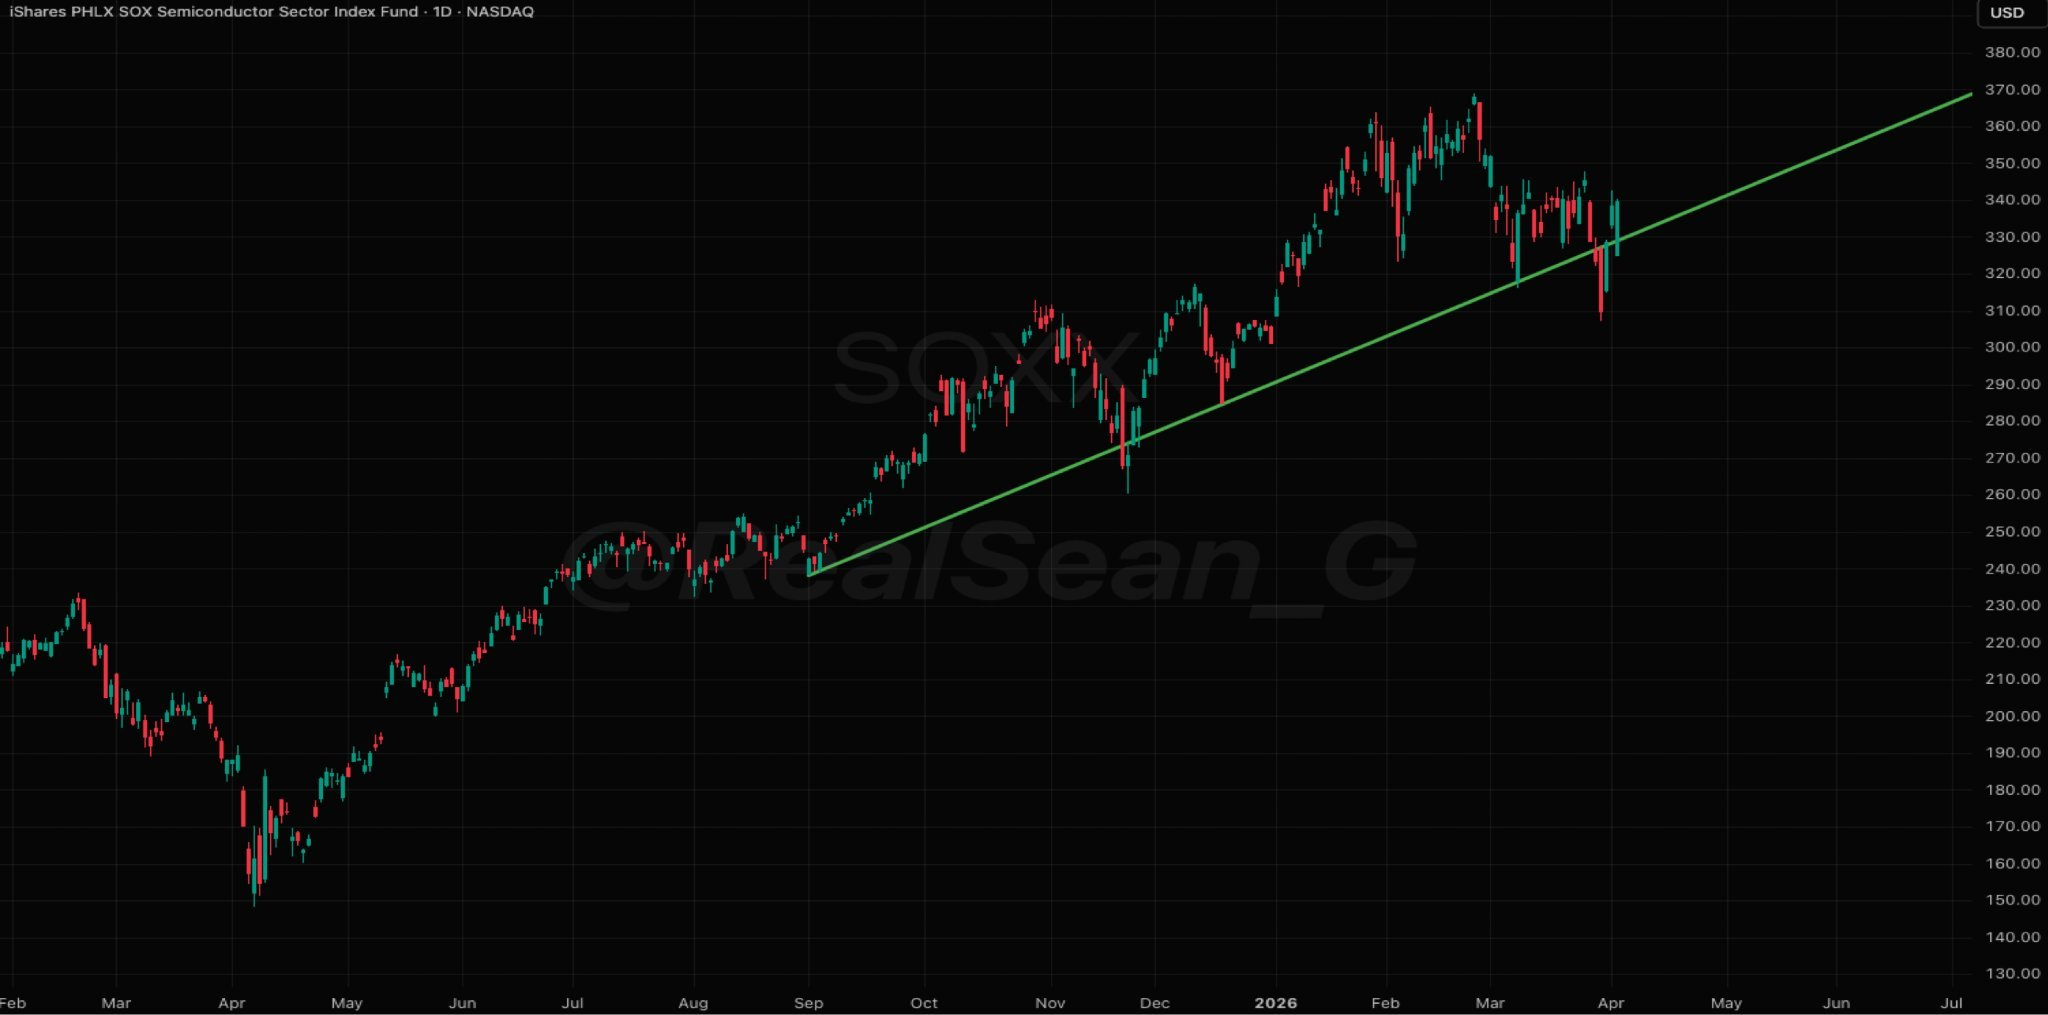
SOXXIf de-escalation is in order, semis should continue to lead higher, just as bellwether sectors usually do when markets emerge from a correction or bear market.
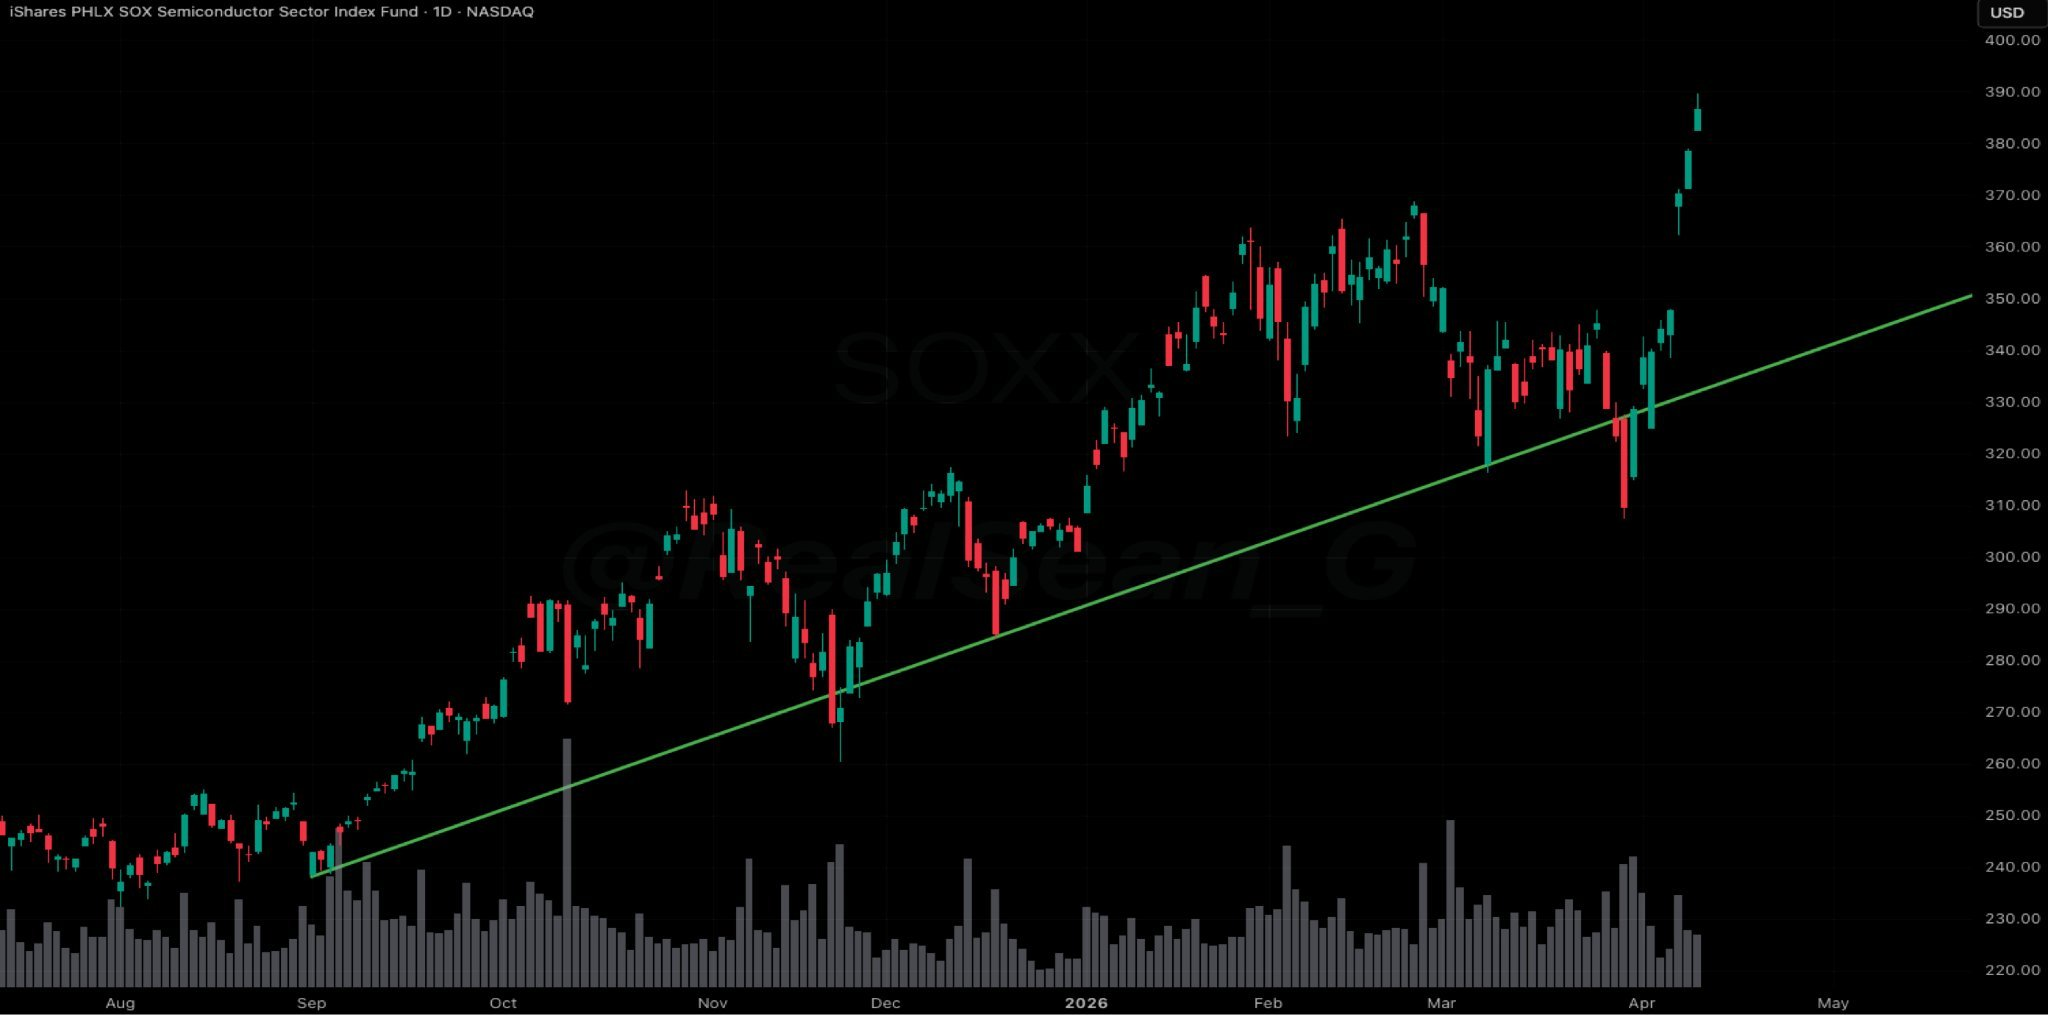
SOXXSemis led the move higher, just as we expected from the bellwether sector.
Note that SOXX (Semiconductor ETF) is overextended on both the weekly and monthly charts. Such vertical moves never end well. Remember how we identified the top in gold back in January? This is a very similar playbook. As price goes vertical, a trailing stop can work well to protect your profits while riding the last wave.
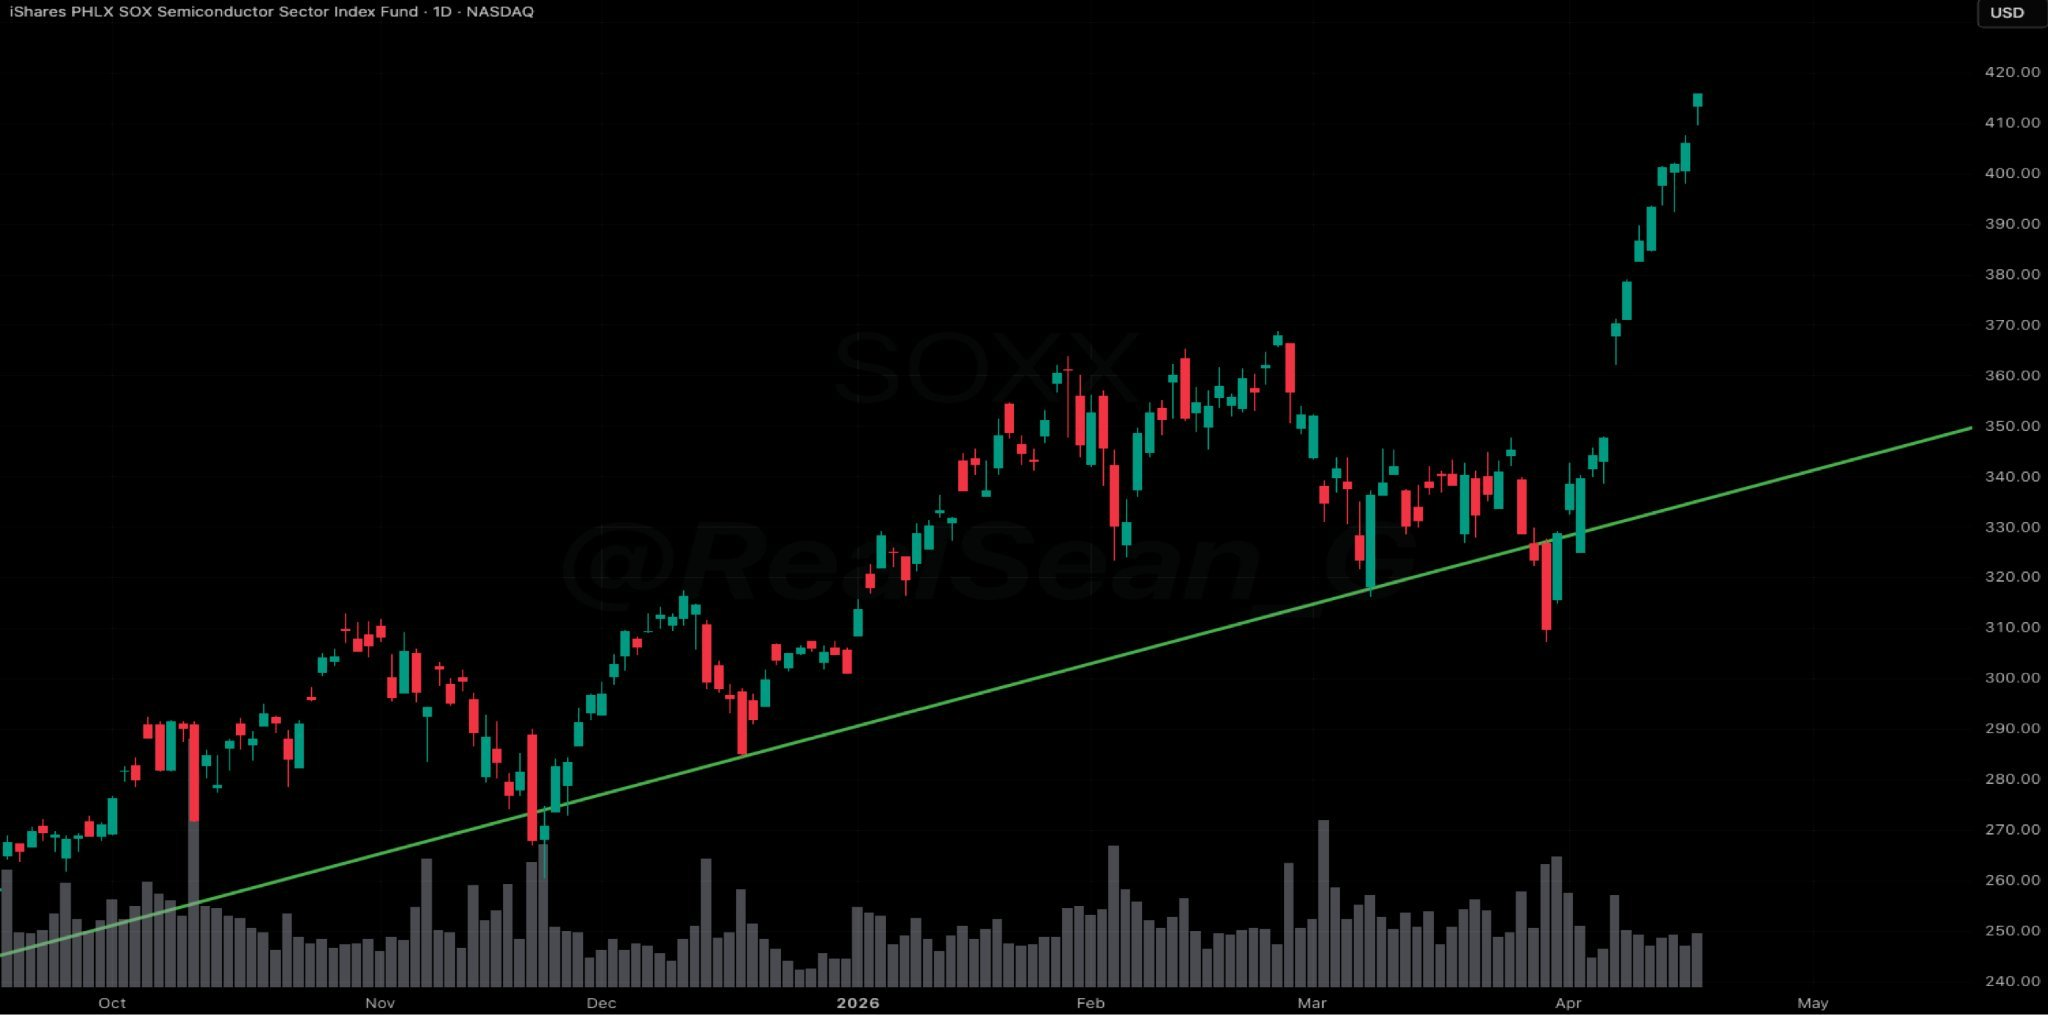
SOXXWe shorted SOXX (Semiconductor ETF) at the top on Monday, only to be trailed out on Wednesday. Semi momentum remains exceptionally strong, as Friday marked a new ATH.
As we have entered a new month, the Bollinger Bands are flashing less worrisome signs. Still, gravity should pull it back to the uptrendline support for a retest.
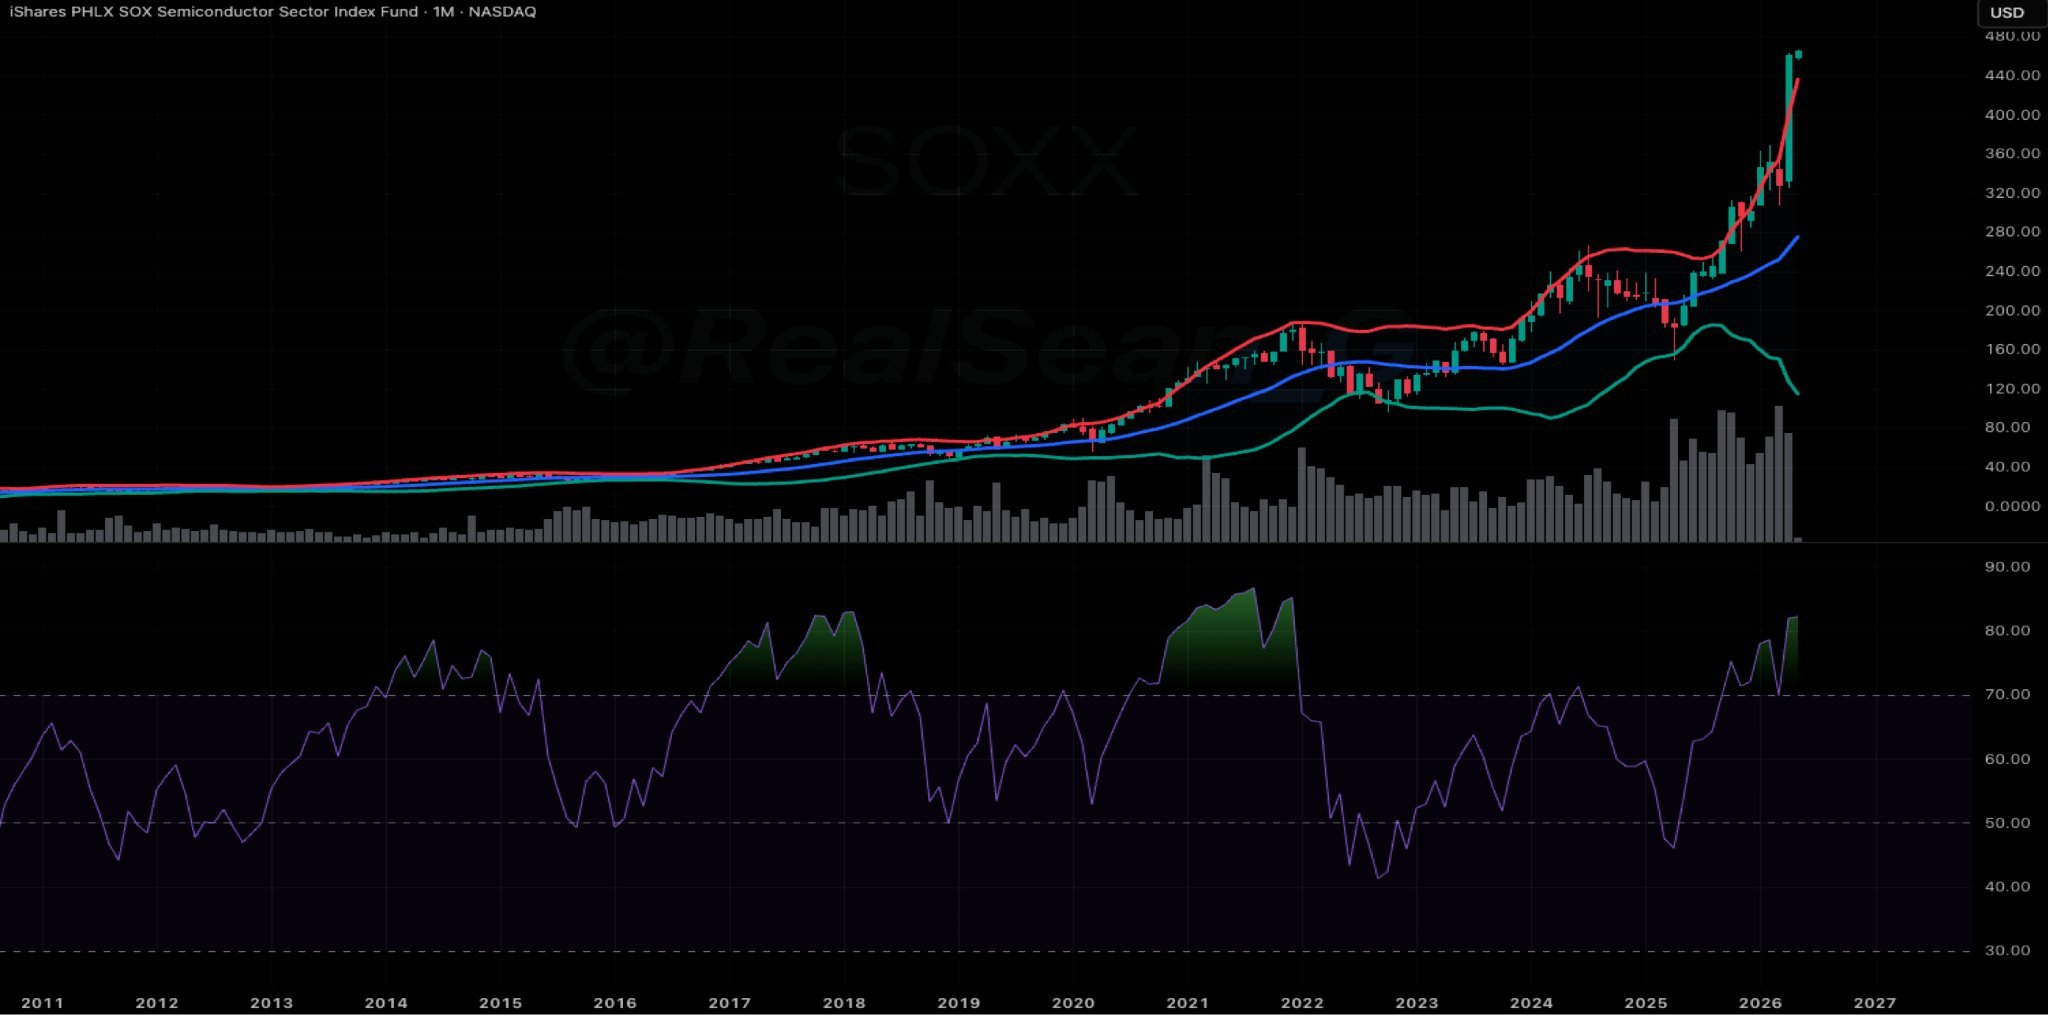
SOXXI had expected a pullback before the euphoria resumed in 1999 fashion, before eventually collapsing. But the market appears to need no break and has decided to run full speed.
For bears, wait for confirmation before entering. The market can stay irrational longer than you can stay solvent. For bulls, risk management is paramount in this environment. Protect your profits with stops.
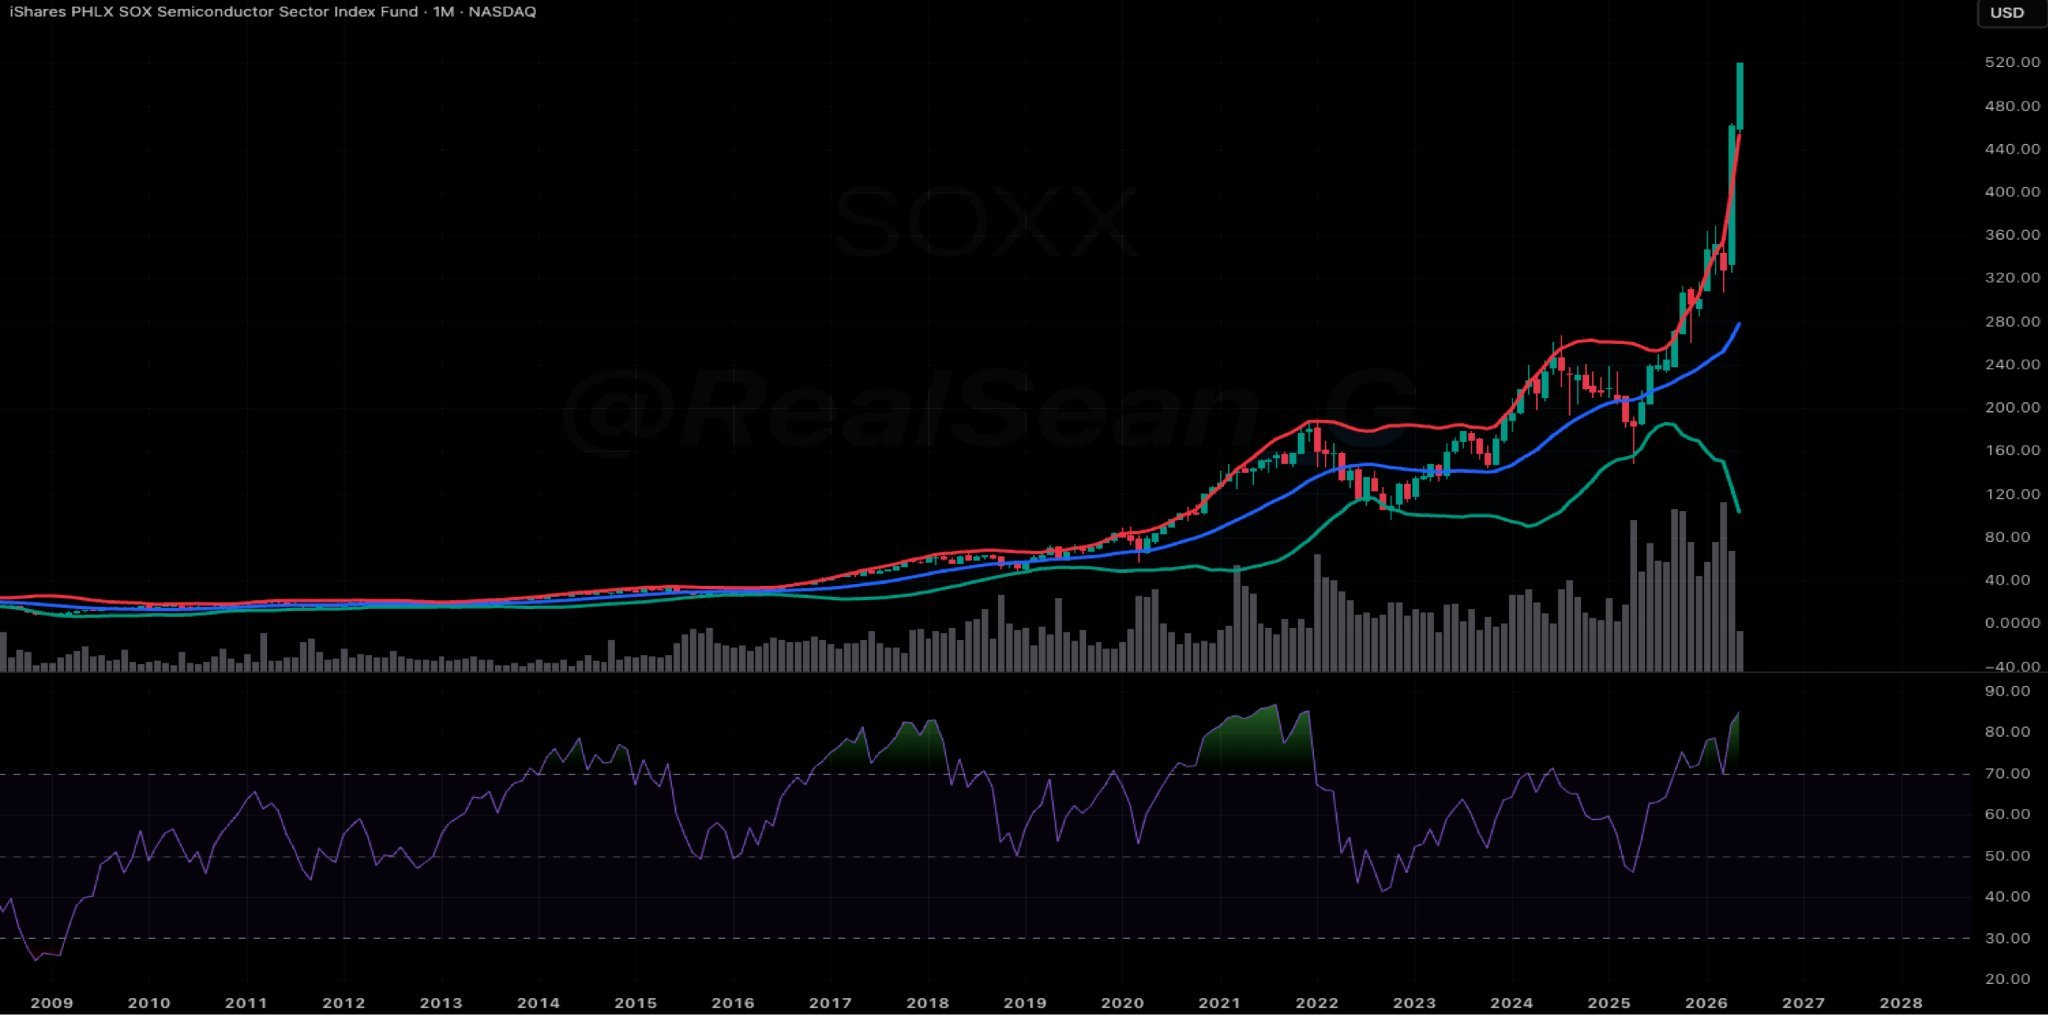
SOXXThis feels like late March 2000. If you look at the SOX (Semiconductor Index) chart, it closely resembles the dot-com terminal rally that ended the tech bull market.
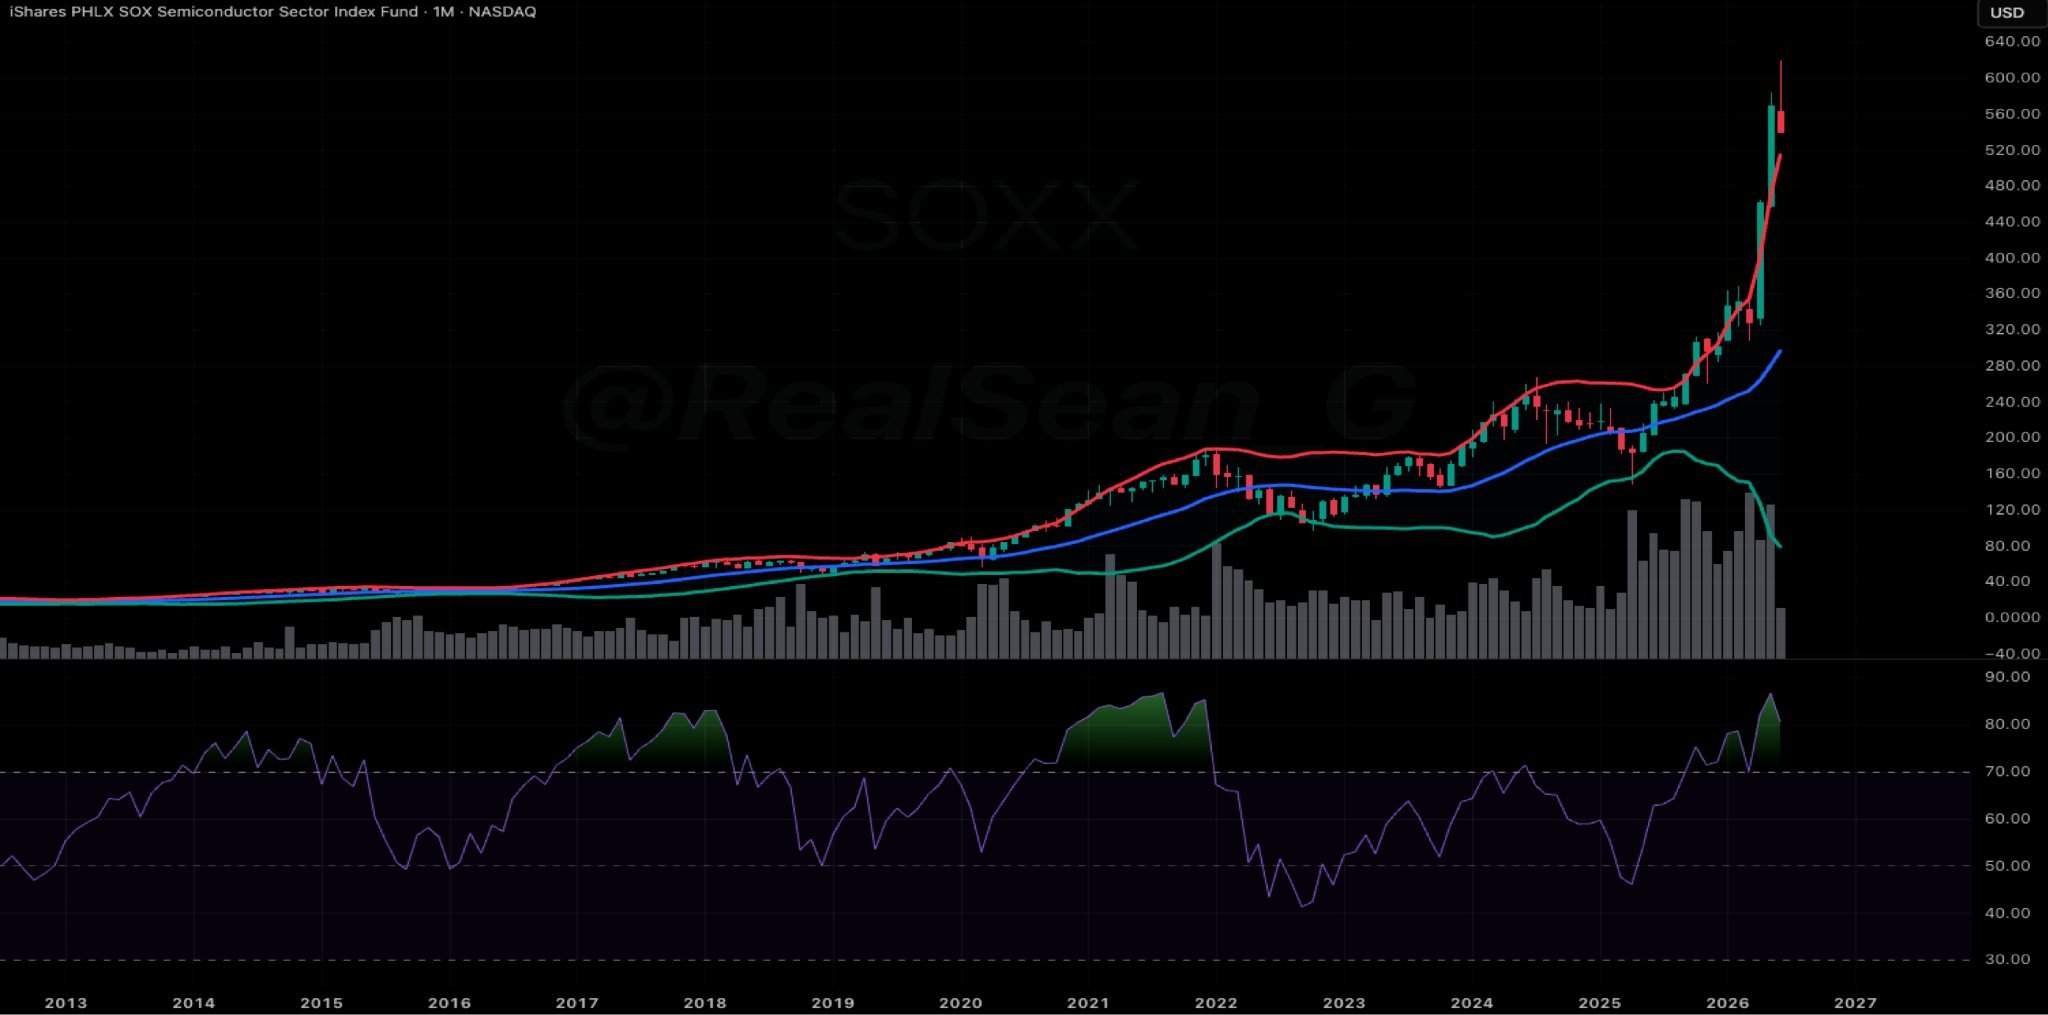
Despite the sharp drawdown on Friday, SOXX (Semiconductor ETF) remains overextended. This could be the beginning of a much larger and widely anticipated correction.
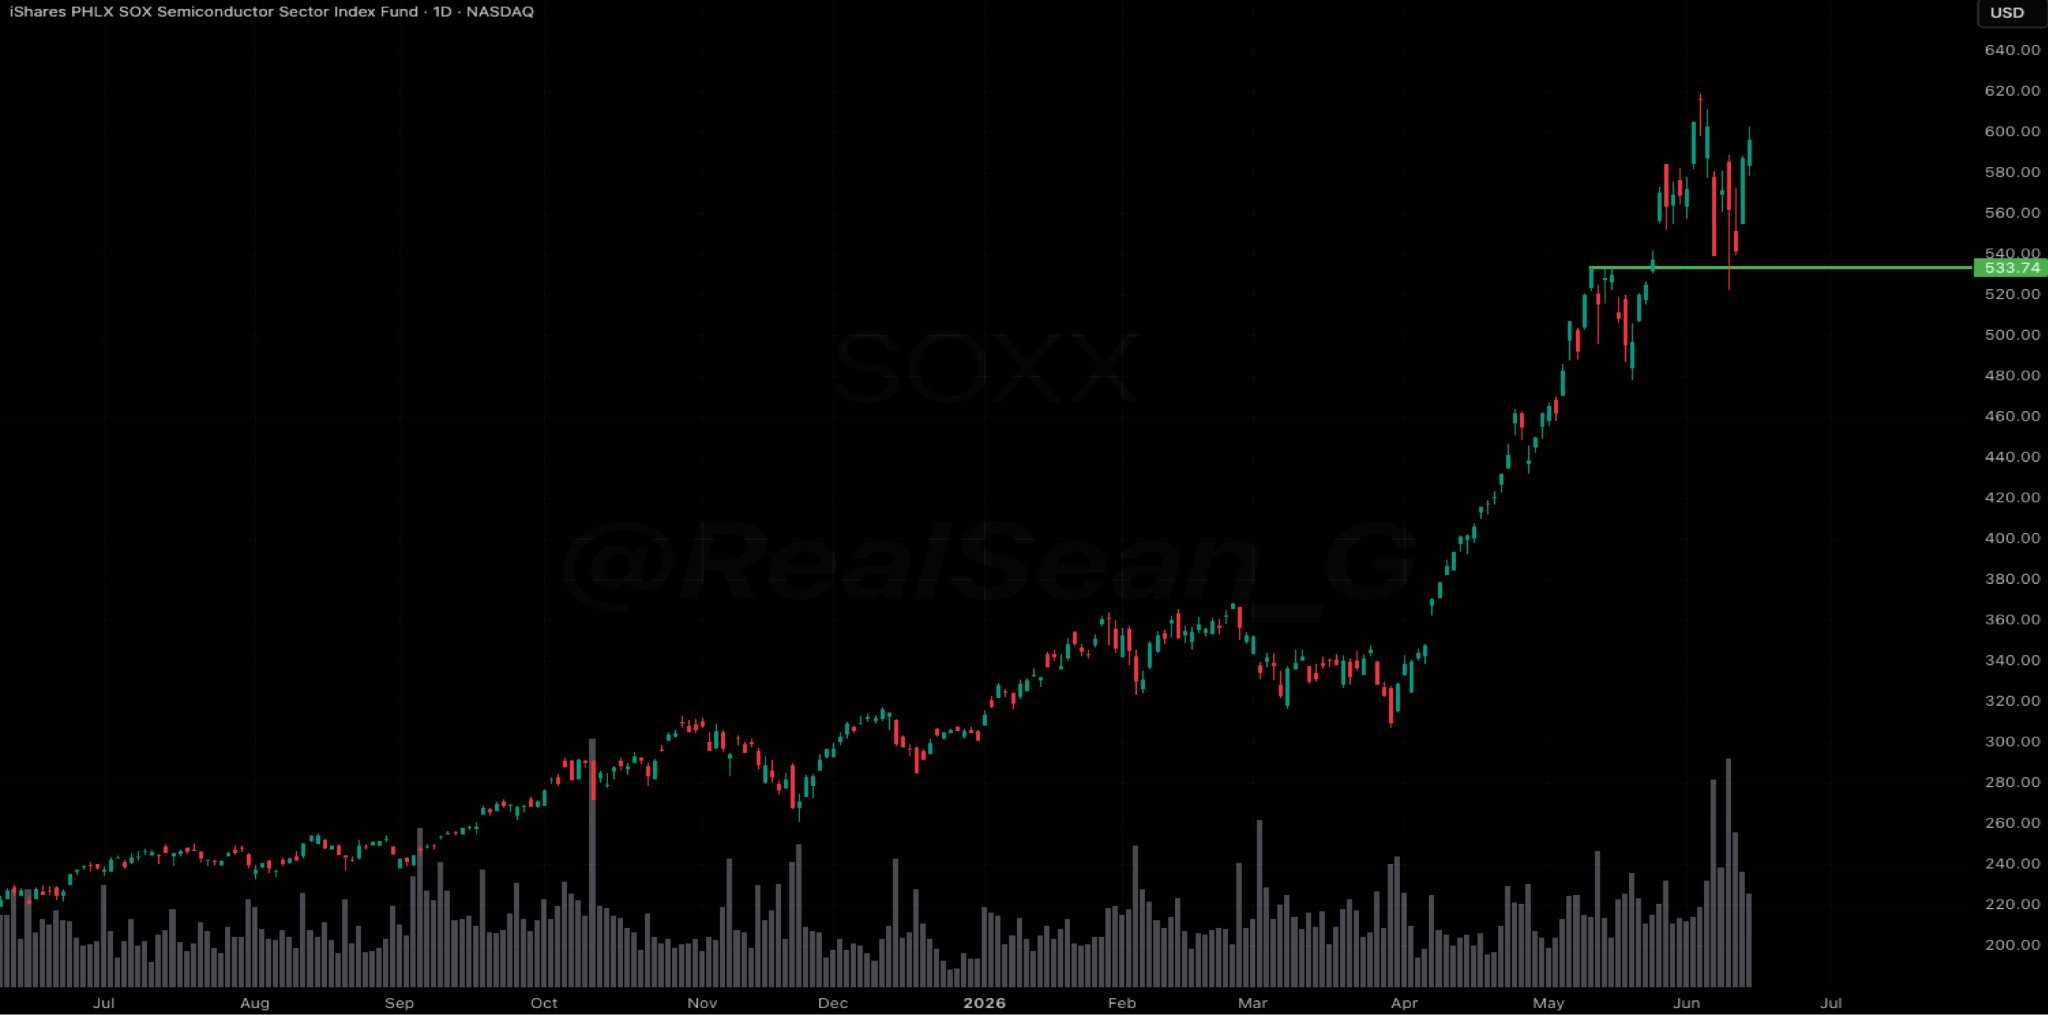
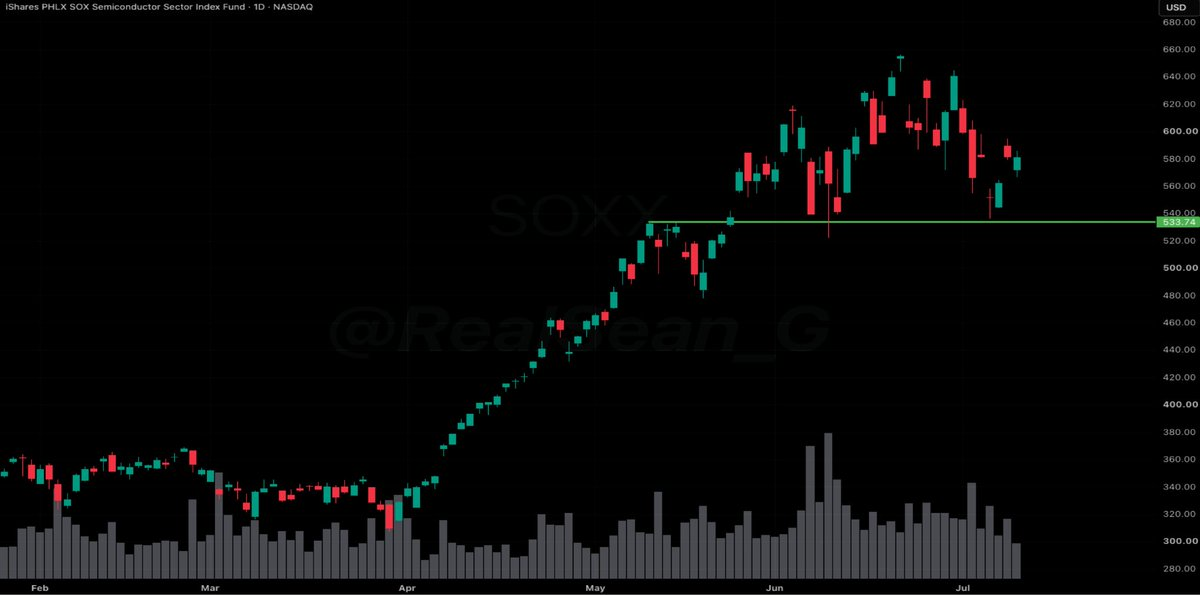
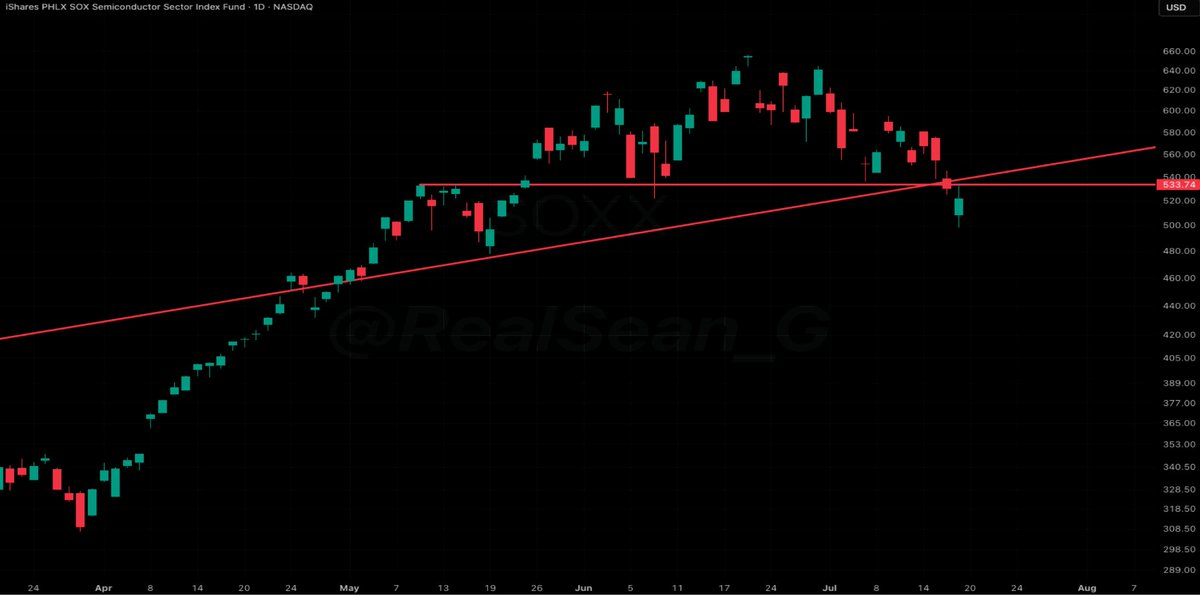
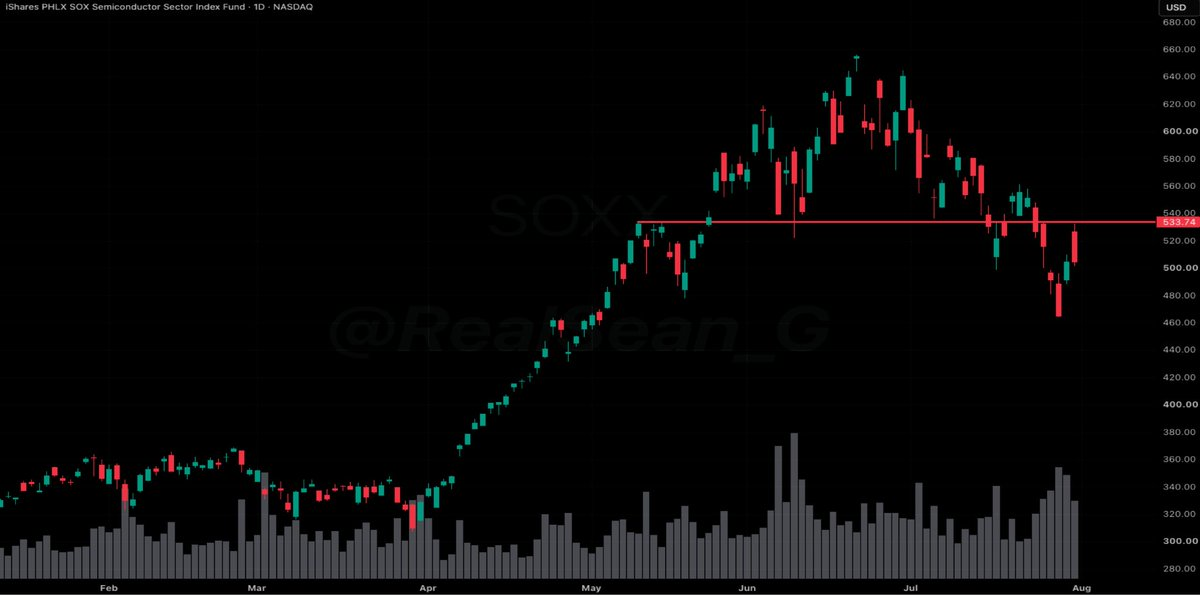
SOXXSOXX (Semiconductor ETF) bounced from horizontal support around 533. Despite the recent drawdowns, the sector remains overextended on the larger timeframe.
Bulls need to hold 533 to keep the rebound alive; a break below would put the correction back in control.
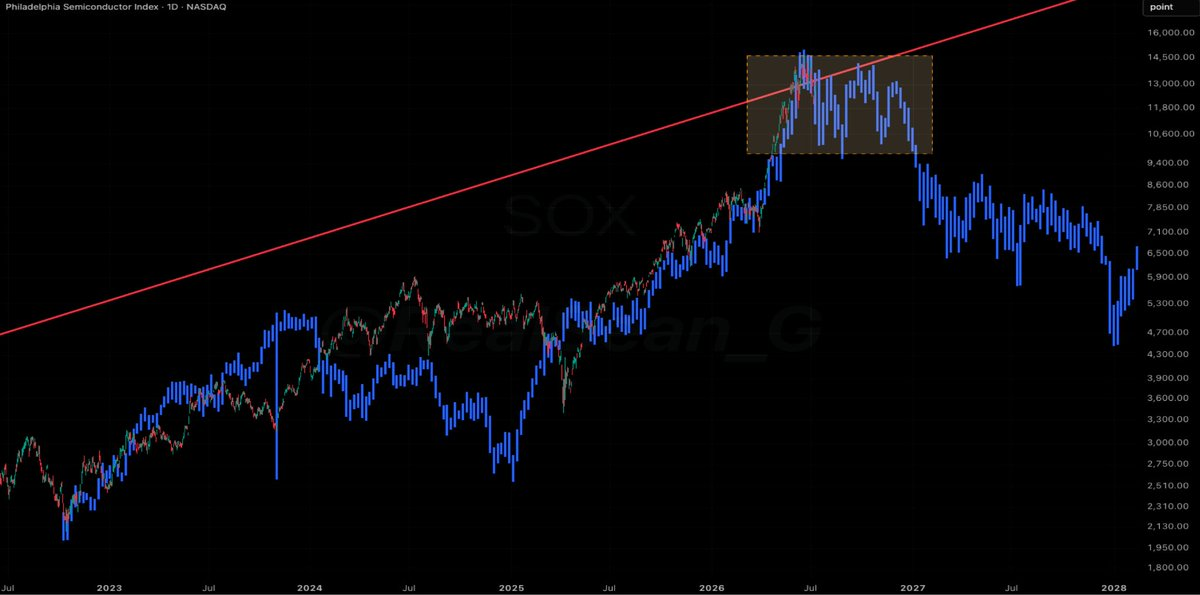
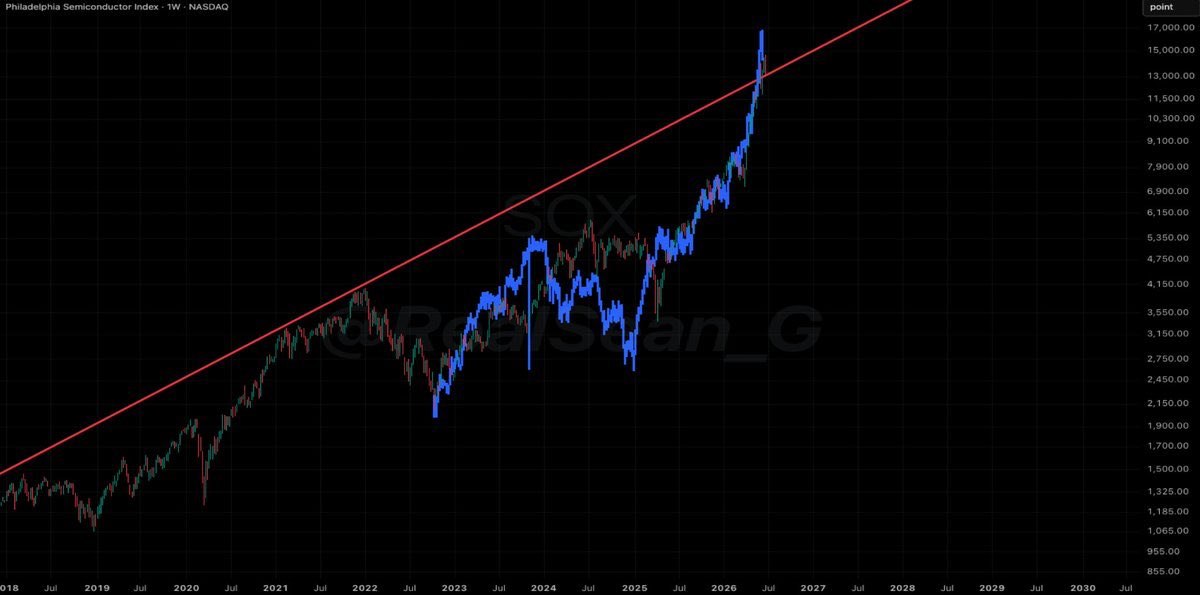
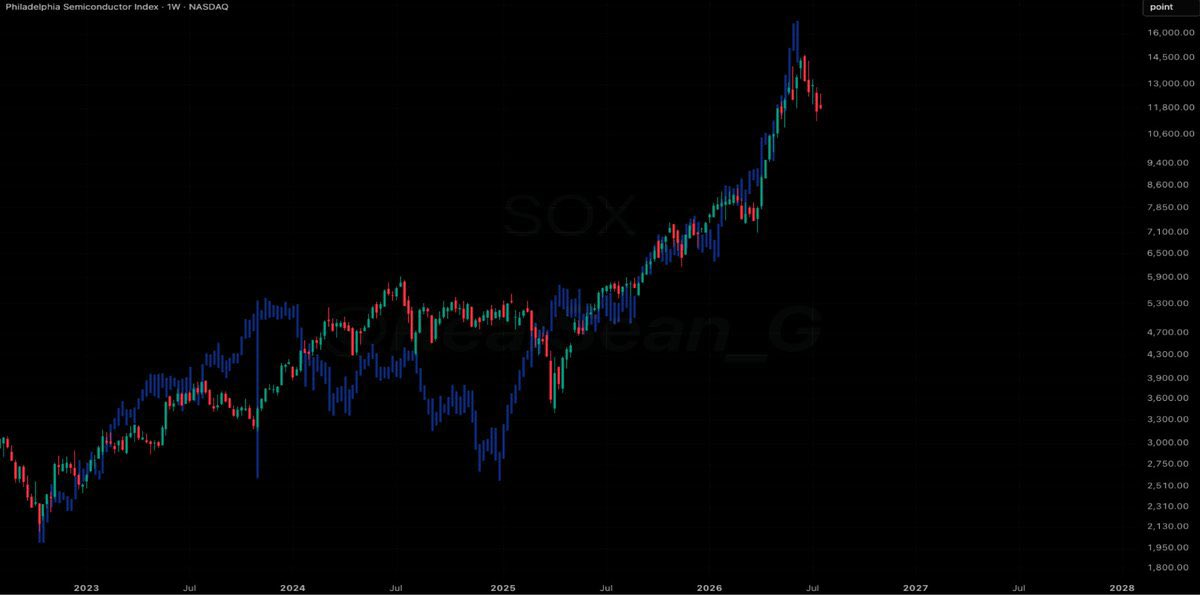
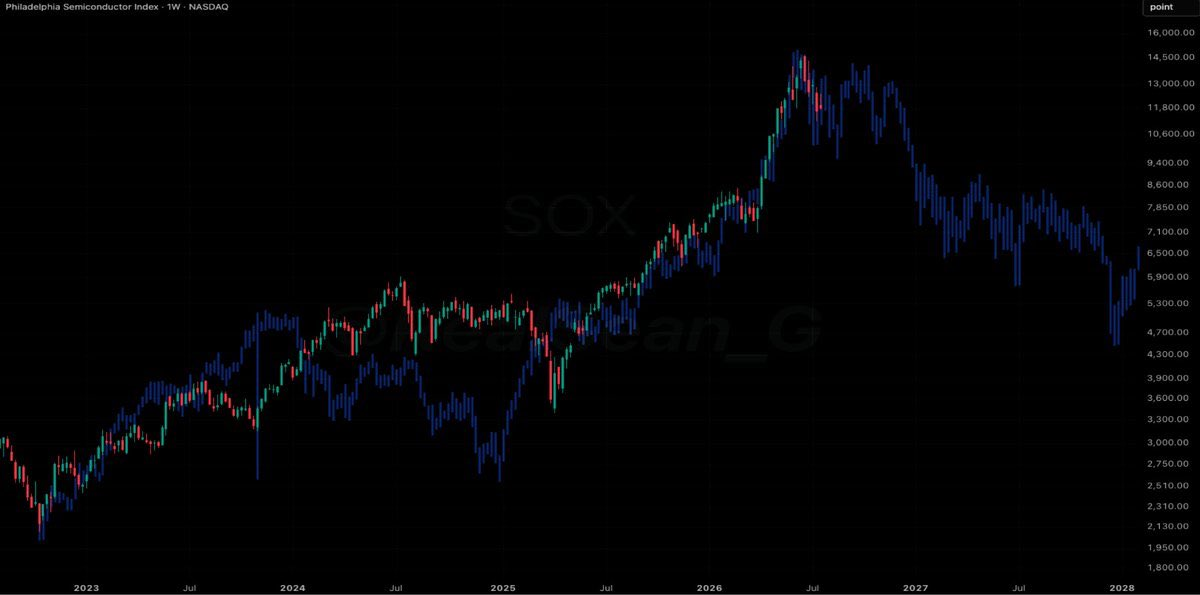
SOX The blue line is SOX (Semiconductor Index) during the Dot-com bubble. Look familiar?
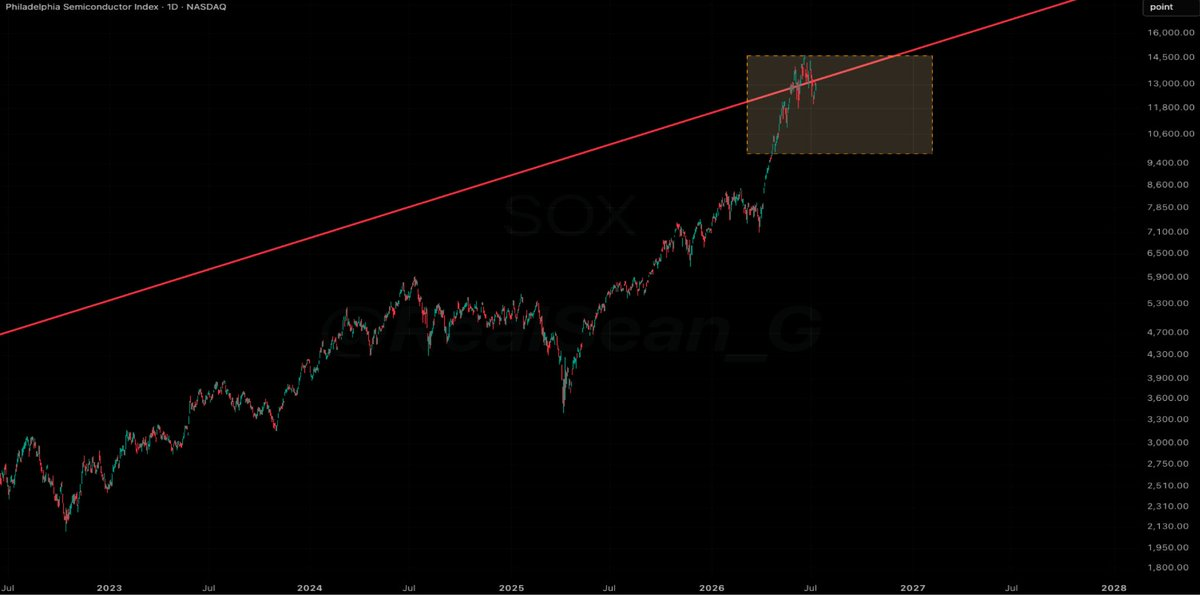
I don't think I need to repeat the similarities. We have laid them out enough. The point now is simple: I expect volatility to pick up from here as SOX enters the distribution phase.
That means more frequent vertical rallies, sharper drawdowns, and wider ranges before the real collapse begins. SOX can still grind higher, and it can still fake strength for longer than bears want. That does not change the bigger setup.
Once a bubble starts unwinding, volatility expands first, then trend breaks. Do not mistake violent bounces for strength.
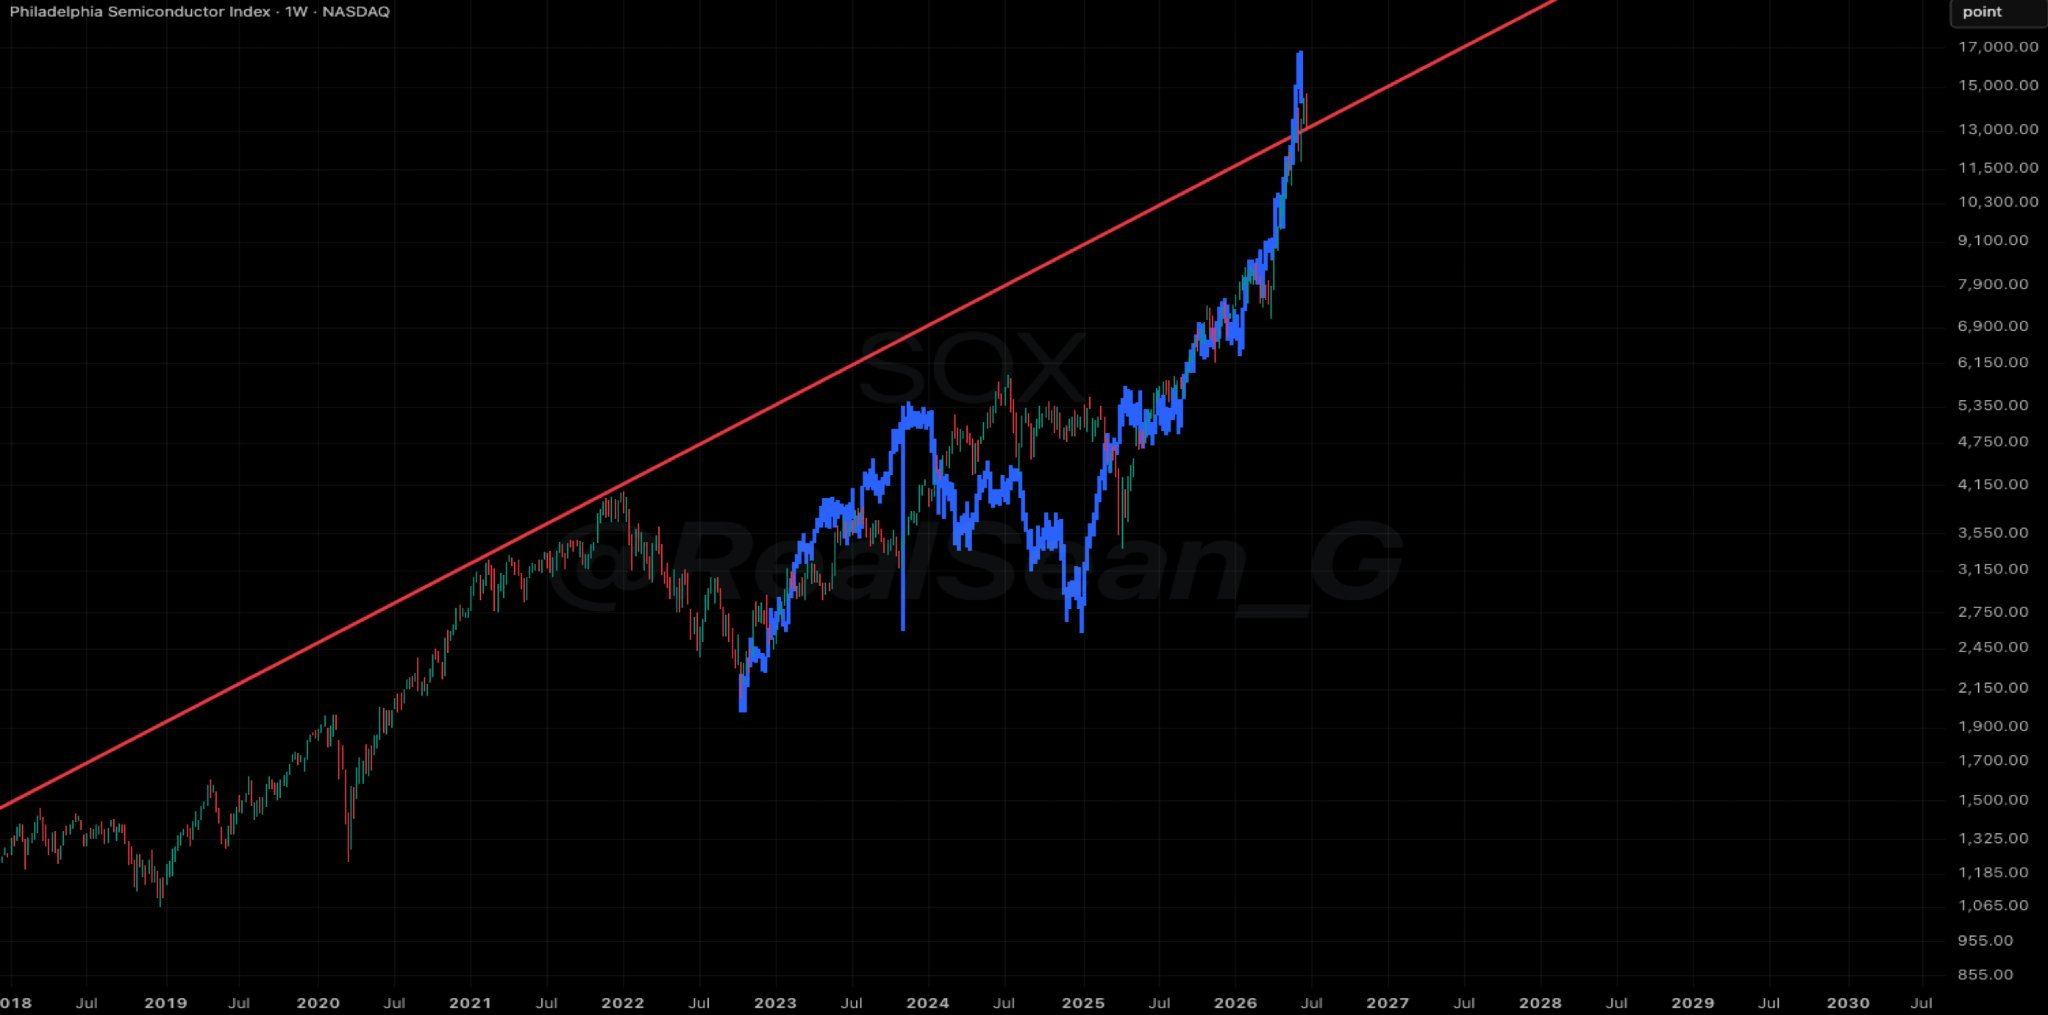
SOX The blue line is SOX (Semiconductor Index) during the Dot-com bubble.
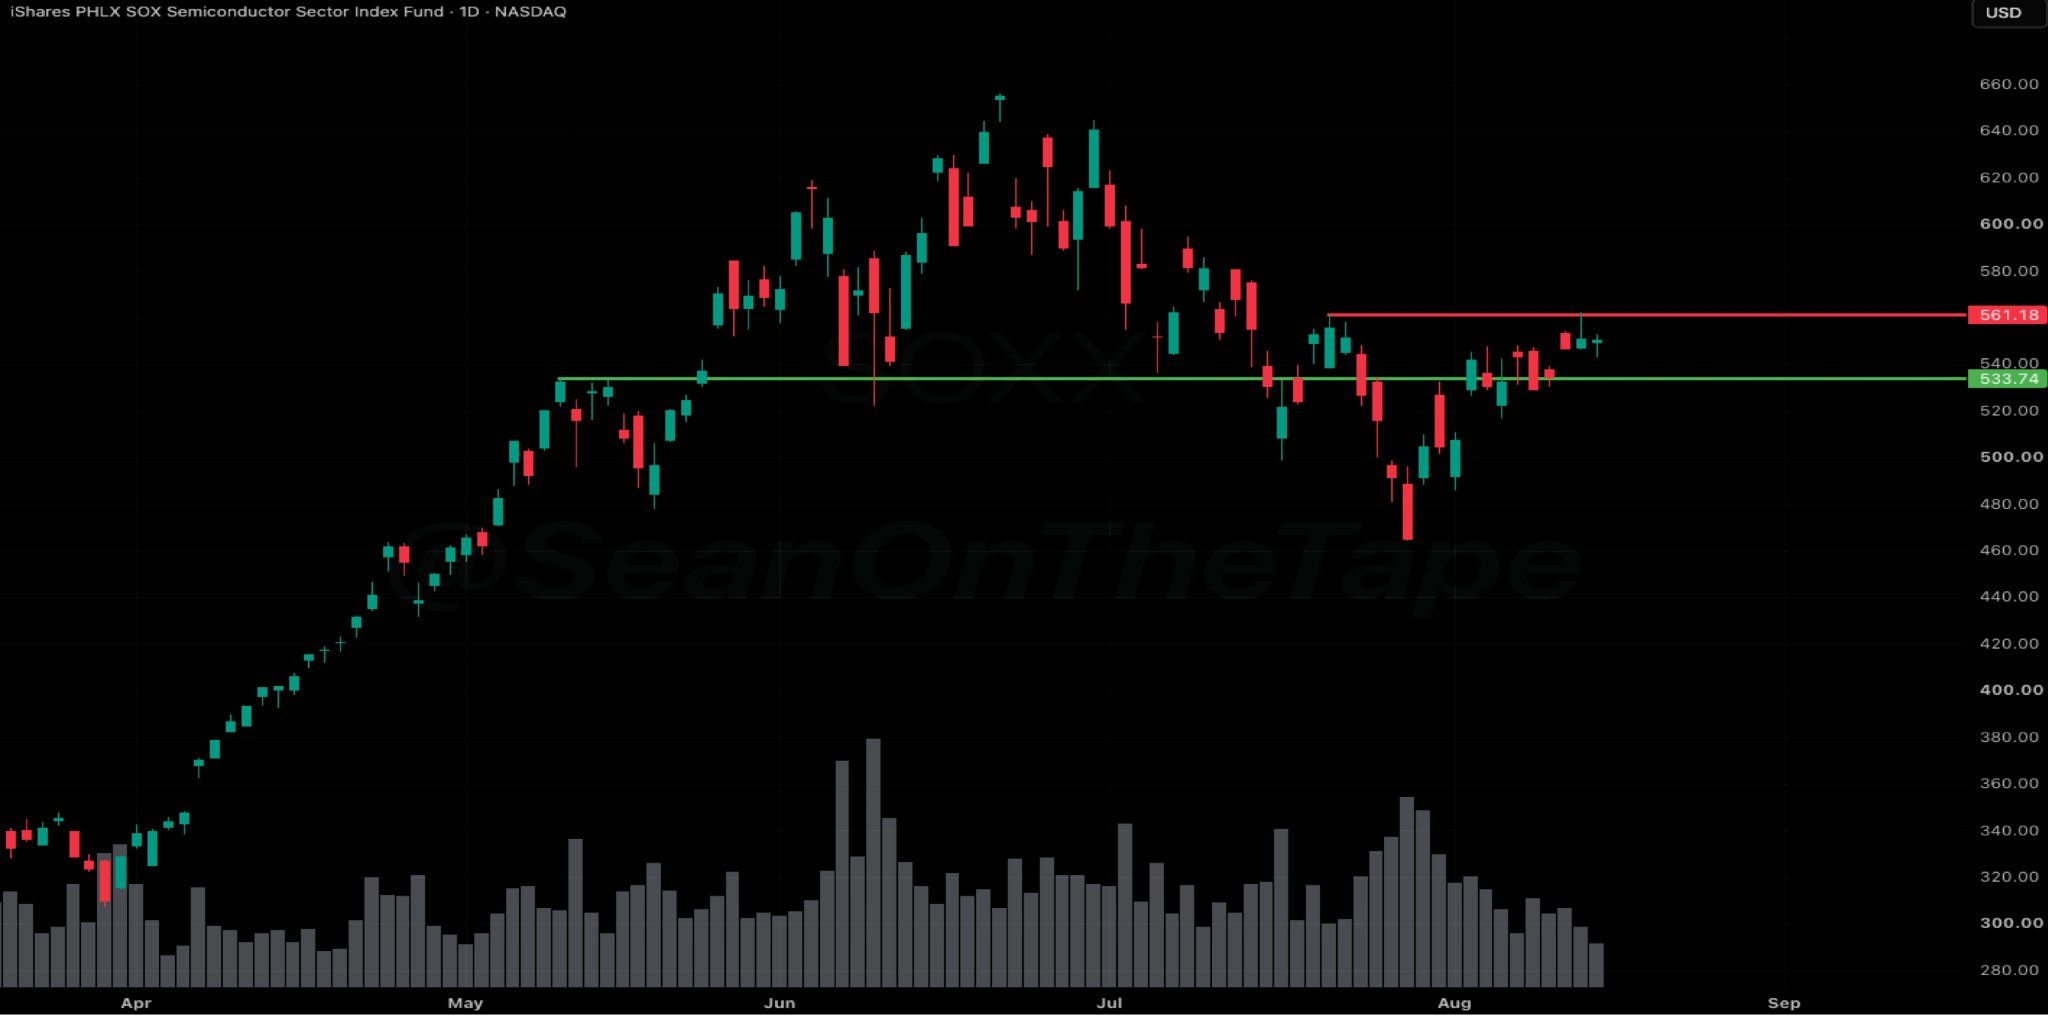
SOXXSOXX held 534 again and bounced. The sharper drawdowns and violent rebounds are exactly what I expected from the distribution-phase playbook I laid out a few weeks ago. I flagged SOXX for a rebound on both Tuesday and Wednesday.
As long as 534 holds, bulls remain in control. A sustained break below 534 opens the path lower.
SOXX
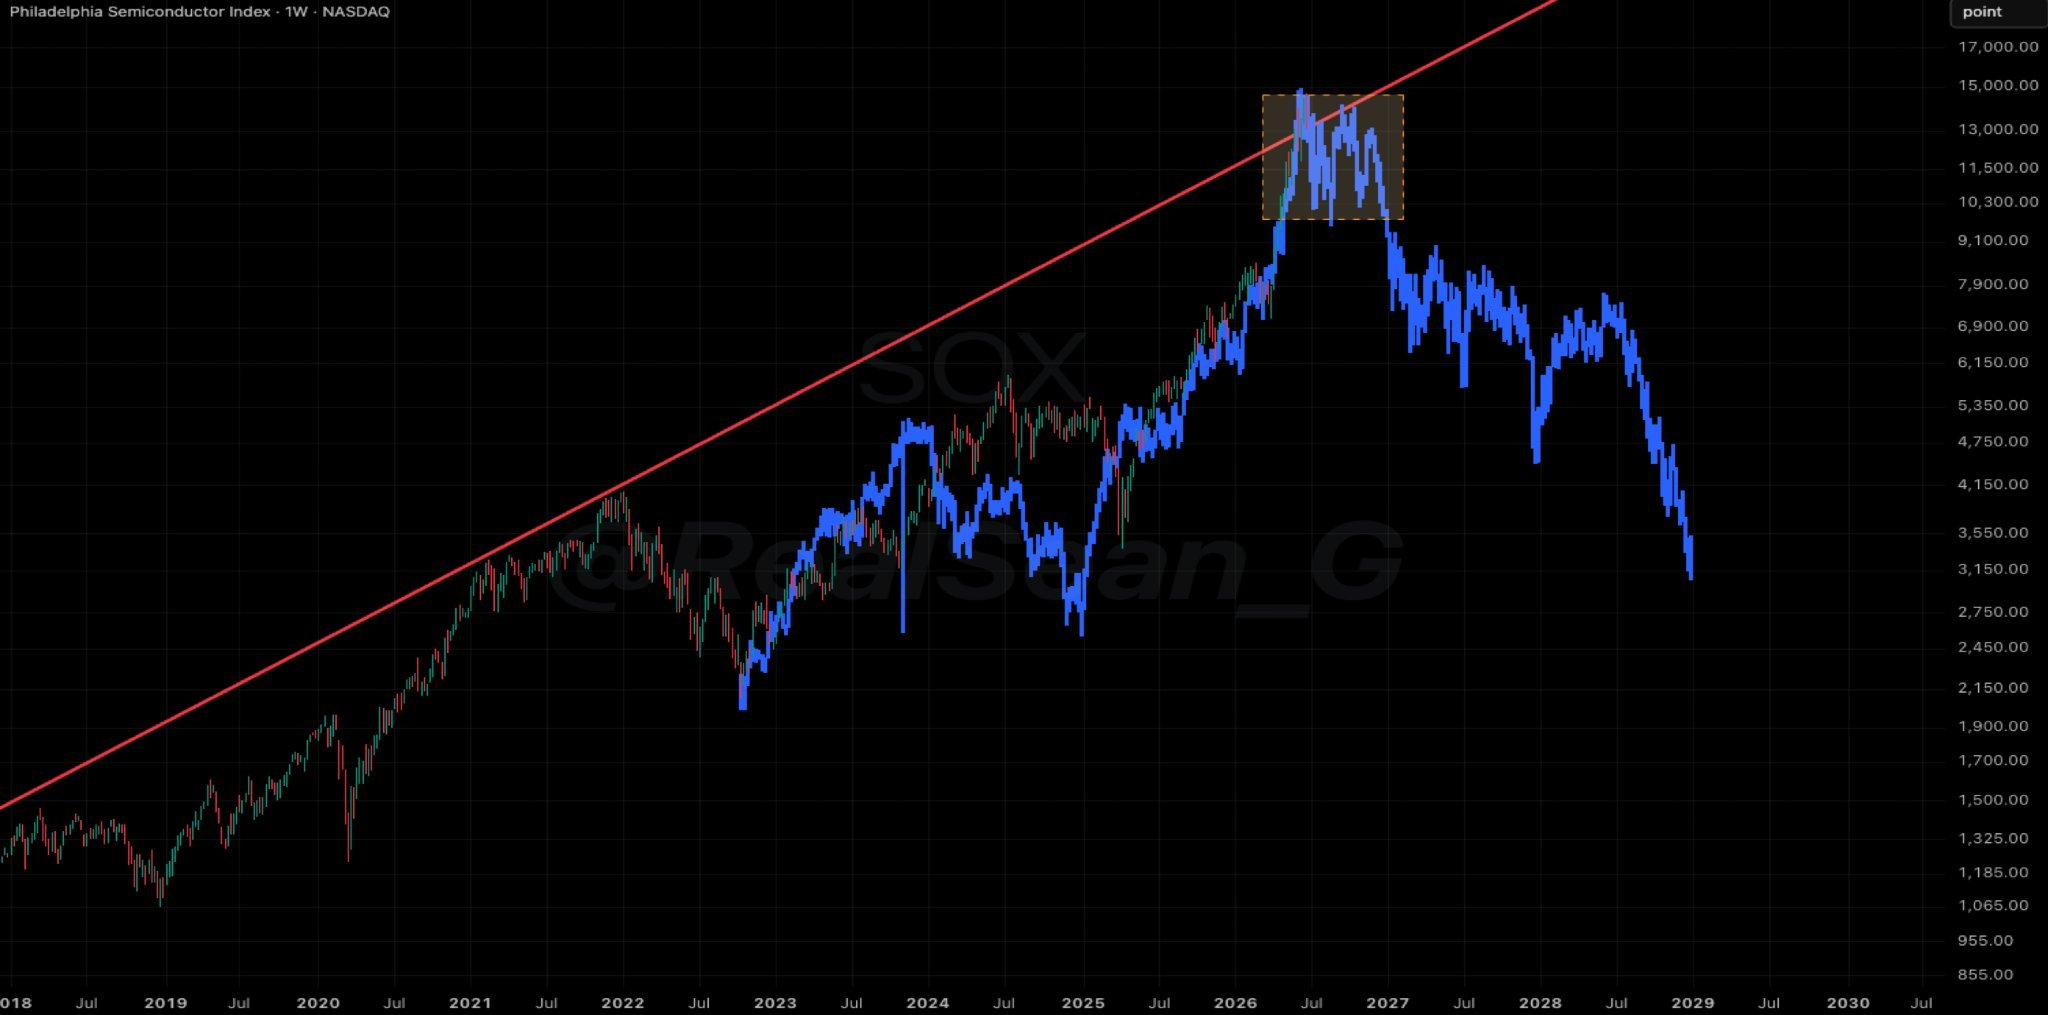
SOXThe blue line is SOX during the dot-com era. So far, SOX has largely followed its dot-com playbook. We’ll see if this time is really any different.
SOXX SOXX broke below 530 and the secular trendline from the 2008 low on Thursday. Friday's close below 530 confirmed the break. This is the first confirmed breakdown in a bellwether sector and likely marks the beginning of the end.
530 should cap any rebound. Bulls threw everything they had at defending the level on Friday but still failed to hold it into the close.
Unless SOXX reclaims 530 over the next few sessions, the path of least resistance remains lower, keeping pressure on NDX and ES.
SOXI showed you the charts below a month ago, just as SOXX peaked, and laid out the exact path semiconductors followed during the dot-com unwind. Since then, SOX has tracked that path with remarkable accuracy.
SOX

SOX
SOX
SOXXAs expected,SOXX printed a new low this week after the relief rally I predicted last week. Price remains below 533 despite Friday's sharp reversal. Unless SOXX closes back above 533 over the next few sessions, the path of least resistance remains lower.
SOXX
From other publications
Loading related content…